Figure 3.
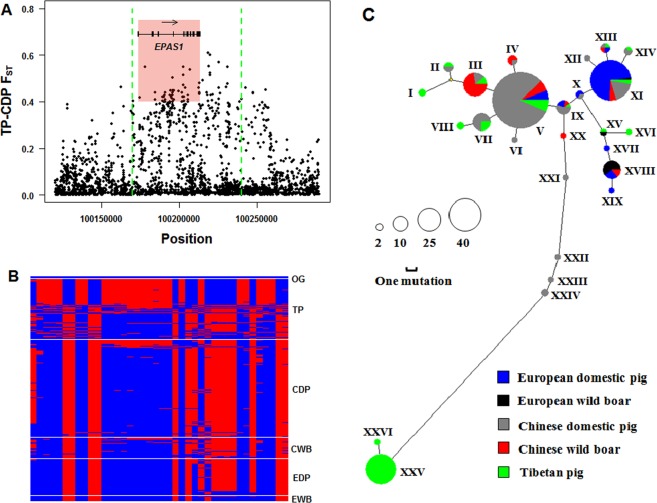
Selective signals and haplotypes of EPAS1. (A) FST values of each SNP between the Tibetan and control populations. The x axis is the physical position on chromosome 3 (Sus scrofa 10.2 build). The region between the two green dashed lines is the candidate sweep. The red box defines the SNPs with the largest genetic differentiation, used to analyze haplotypes. (B) Haplotype pattern of highly differentiated SNPs between the Tibetan and control pig populations using 227 pigs from East Asia and Europe. Each column is a polymorphic genomic location and each row is a phased haplotype. The blue cell represents the ancestor allele and the red cell represents the derived allele. OG: outgroup, TP: Tibetan pigs, CDP: Chinese domestic pig, CWB: Chinese wild boar, EDP: European domestic pig, EWB: European wild boar. (C) The Median-Joining network of haplotypes within EPAS1. Only haplotypes with frequency more than 1 were used to draw the network.

