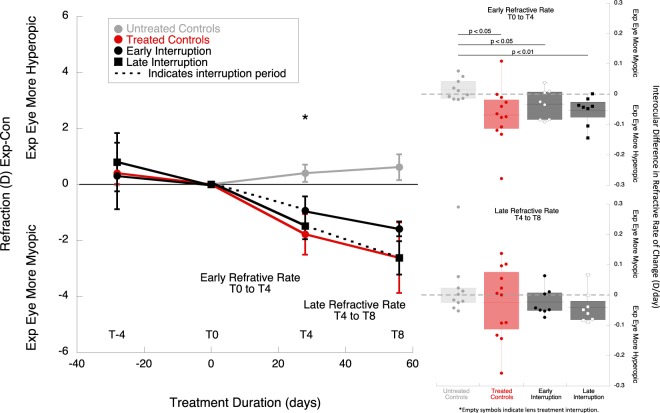
Figure 3.
(left) Average interocular differences in refractive error for the experimental and control eyes in each experimental group, normalized to baseline. The early interruption group is represented by black circles, and the late interruption group by squares. The interruption period is indicated with dotted lines. The results from these two treatment groups were compared to treated controls (continuous lens wear, red symbols) and untreated contols (grey symbols). (right) Box plots representing the changes in interocular differences in refractive rate (exp-cont) during the early (T0 to T4), and late treatment period (T4 to T8) for the different treatment groups: treated controls (red), early interruption (black), late interruption (grey) and untreated control (no color). The interruption periods are indicated by empty symbols. The data shown are mean ± SE.

