Fig. 1.
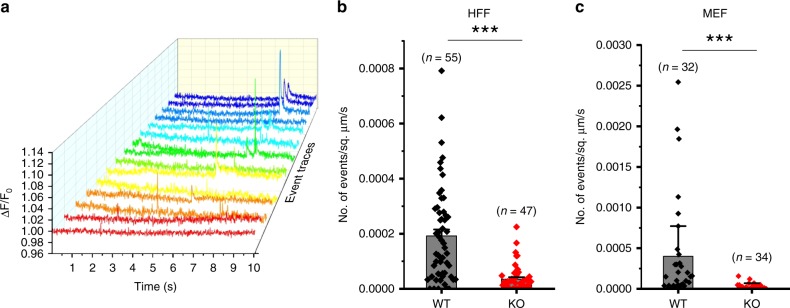
Piezo1 channels generate Ca2+ flickers. a Representative Ca2+ flickers recorded from HFF cells. Traces show fluorescence ratio changes (ΔF/F0) from multiple regions of interest of a video, plotted over time and in different colors for clarity. b Frequency of Ca2+ flickers in wild-type HFFs and in Piezo1-knockout HFFs. Bars denote mean ± SEM and each point represents flicker frequency in an individual video. c Frequency of Ca2+ flickers in Piezo1-knockout MEFs and in Wild-type MEFs derived from littermate embryos. n values for panels b and c denote number of videos (i.e., unique fields of view, each composed of one or more cells) from four experiments. ***p < 0.001 by Kolmogorov–Smirnov test. See also Supplementary Fig. 1 and Supplementary Movies 1 and 2. Source data for panels b and c can be found in Supplementary Data

