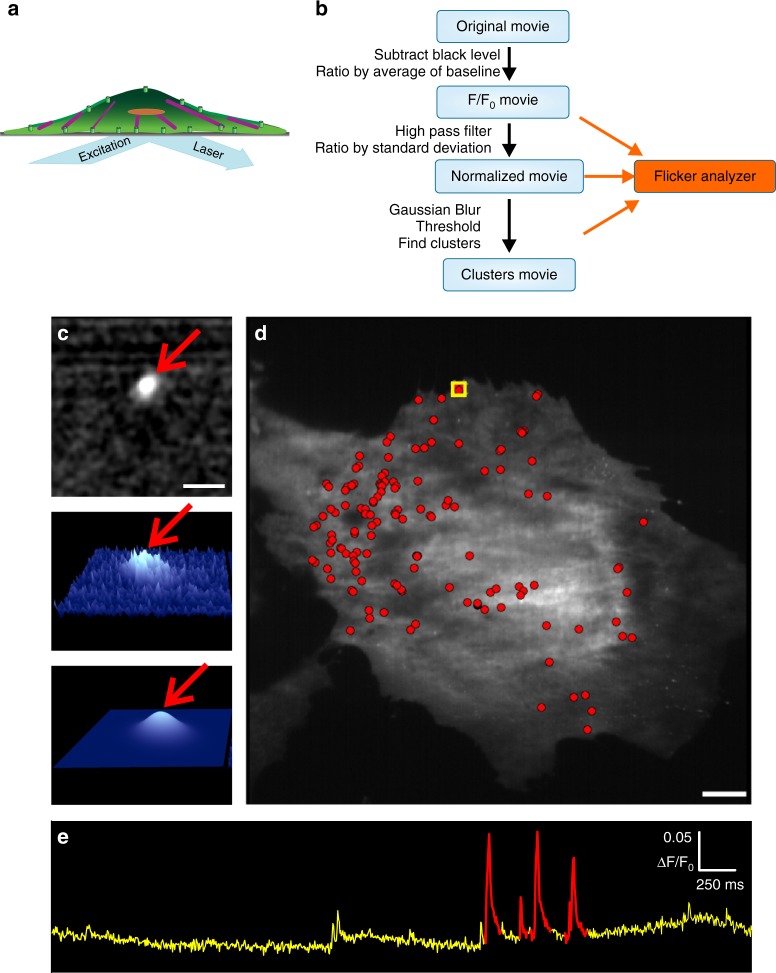
Fig. 2.
Automated detection and super-resolution localization of Piezo1-dependent Ca2+ flickers. a Piezo1 Ca2+ flickers are acquired by Ca2+ imaging with total Internal reflection fluorescence microscopy (TIRFM). b Flowchart of the algorithm. The original movie is processed to subtract camera black level and then divided by the average of the first ~100 frames to produce an F/F0 ratio movie. The ratioed movie is spatially and temporally filtered to increase the signal-to-noise ratio. A clustering algorithm groups supra-threshold pixels into flicker events. c For every event detected, a 2D Gaussian fit to the fluorescence intensity identifies with subpixel accuracy the centroid of the fluorescence, and therefore of the ion channel(s) producing the Ca2+ signal. Top panel shows a representative images of a region of interest showing a processed, filtered Piezo1 flicker event (red arrow). Middle panel shows a 3D representation of the event and the bottom panel shows a Gaussian fit to the event. Arrow in bottom panel marks the peak of the Gaussian profile that identifies with sub-pixel accuracy the location of the centroid of the Ca2+ flicker. d Flicker localizations (red dots) overlaid on an image of a MEF to map sites of Piezo1 activity. e Flicker activity from the region of interest marked in D plotted over time as fluorescence ratio changes (ΔF/F0). Identified flicker events are highlighted in red. Scale bars = 10 µm. See also Supplementary Movie 3 and Supplementary Fig. 2

