Fig. 3.
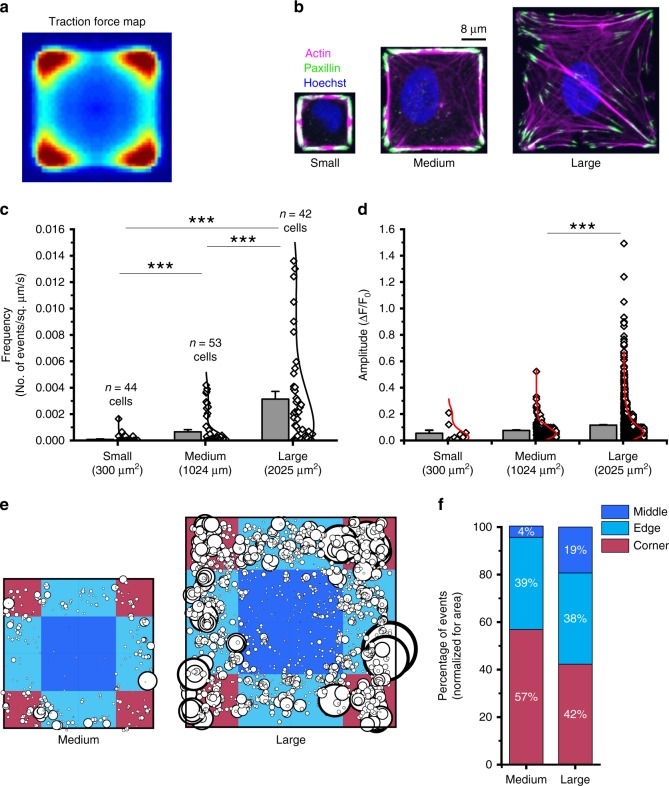
Piezo1 Ca2+ flickers are enriched in regions of cells predicted to have higher traction forces. a Cells constrained to square micropatterned substrates generate the largest traction forces at corners (red), lower forces at edges (cyan), and lowest traction forces in the middle of the cell. The image is reproduced from Holt et al.46 under CC BY 4.0 license. b Cells seeded on square fibronectin islands yield a single square cell per island. Images are representative confocal slices of hNPSCs stained for the actin cytoskeleton (phalloidin, magenta), the focal adhesion zone protein, paxillin (anti-paxillin antibody, green), and the nucleus (Hoechst, blue). Note the larger number of actin stress fibers terminating in focal adhesions as cell spread area increases. Island sizes used: small, 300 µm2; medium 1024 µm2; large, 2025 µm2. c Cells on larger square islands display more Piezo1 Ca2+ flickers as evidenced from the frequency of Piezo1 Ca2+ flicker events for HFF cells seeded on small, medium, and large islands. Number of cells imaged for each size is noted in the graph. ***p < 0.001 by Kolmogorov–Smirnov test. d Flicker amplitudes are larger in cells with larger spread area. Data are from 9 flicker events from 44 small cells, 355 events from 53 medium and 2411 events from 42 large cells. ***p < 0.001 by Kolmogorov–Smirnov test. e Localization and amplitude of flicker events in medium and large cells. Location of each flicker events from medium and large cells is represented on a square in which the corner (red), edge (cyan), and middle (blue) regions are marked. Each circle represents the site of a flicker event, with the size of the circle scaled by the amplitude of the flicker. f Quantitation of flicker events from e in middle, edge, and corner areas of medium and large cells. A chi-square test was performed to determine whether the observed distribution is different from chance: for medium cells χ2 (2, N = 355) = 108.38, p < 0.0001, and for large cells, χ2 (2, N = 2411) = 161.89, p < .0001. See also Supplementary Fig 3. Source data for c and d can be found in Supplementary Data

