Fig. 3.
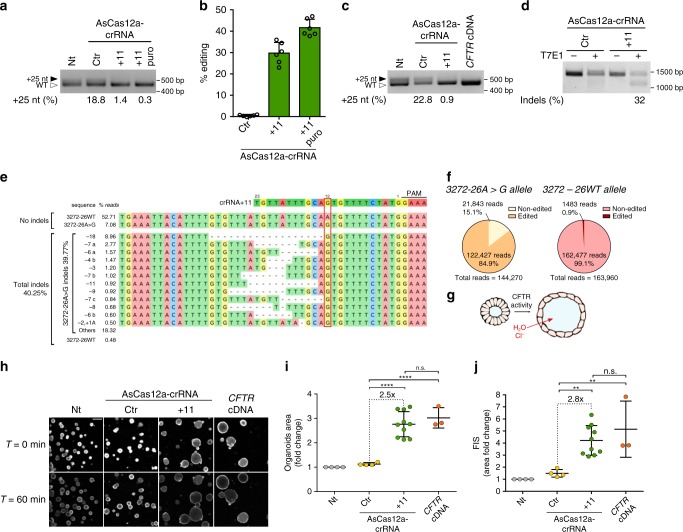
AsCas12a-crRNA+11 genome editing analysis in 3272-26A>G models. a Splicing pattern analysis by RT-PCR in 3272-26A>G primary airway cells following lentiviral transduction (15 days) of AsCas12a-crRNA control (Ctr) or specific for the 3272-26A>G mutation (+11). Puromycin selection was performed for 72h in +11 puro. Black-solid arrow indicates aberrant splicing, white-empty arrow indicates correct splicing. The percentages of aberrant splicing (25 nt insertion into mRNA) was measured by chromatogram decomposition analysis (Supplementary Fig. 5). b Percentages of indels generated in intron 20 by crRNA+11 in cells treated as in a measured by TIDE analysis. Data are from n = 2 independent experiments. c Splicing pattern analysis by RT-PCR in 3272-26A>G intestinal organoids following lentiviral transduction (14 days) of AsCas12a-crRNA control (Ctr) or specific for the 3272-26A>G mutation (+11) or with the CFTR cDNA. Black-solid arrow indicates aberrant splicing, white-empty arrow indicates correct splicing. The percentages of aberrant splicing were measured as in a (Supplementary Fig. 6a, b). d Editing efficiency in 3272-26A>G organoids measured by T7E1 assay following lentiviral transduction as in c. e Deep sequencing analysis of the CFTR on-target locus after AsCas12a-crRNA+11 transduction of the 3272-26A>G organoids (average from n = 2 independent experiments) (Supplementary Data 2). f Percentage of deep sequencing reads of the edited and non-edited 3272–26A>G or WT alleles from e. g Schematic representation of CFTR dependent swelling in primary intestinal organoids. h Representative confocal images of calcein green labeled 3272-26A>G organoids before (T = 0 min) and after (T = 60 min) forskolin-induced swelling (FIS) assay (5 µM forskolin). Scale bar = 200 µm. i Quantification of organoid area following lentiviral transduction of AsCas12a-crRNA Ctr, AsCas12a-crRNA+11 or with CFTR cDNA as indicated. Each dot represents the average organoid area analyzed for a single well (number of organoids per well: 25–300) from n = 4 independent experiments. j Fold change in organoid area before (T = 0 min) and after (T = 60 min) the forskolin-induced swelling (FIS) assay, each dot represents the average increase in organoid area analyzed per well (number of organoids per well: 25–300) from n = 4 independent experiments. Data are means ± SD. Statistical analysis was performed using one-way ANOVA; **P < 0.01, ****P < 0.0001, n.s. non-significant

