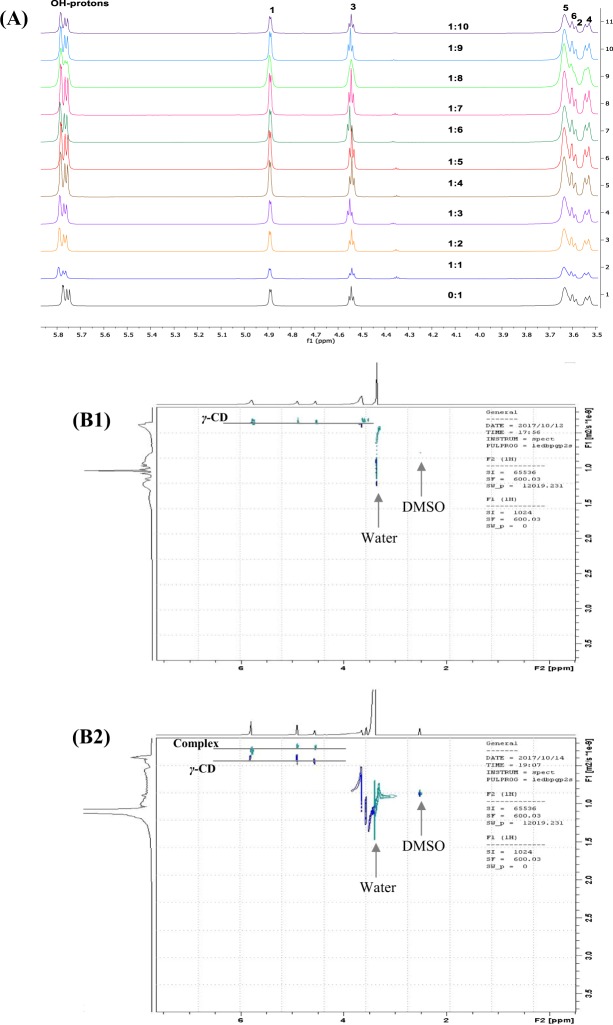
Figure 4.
Effects of Pc-INH on the NMR profiles of γ-CD in DMSO-d6. (A) Partial 1H NMR spectra of γ-CD in different Pc-INH/γ-CD molar ratios (0:1 to 1:10), with numbers 1 to 6 indicating respective signals from γ-CD’s protons (1)–(6) (in reference with Fig. 1B). (B1) DOSY spectrum of γ-CD alone, exhibiting a set of proton signals aligned at the same diffusion coefficient (while the arrows indicate distinctive signals from the solvent). (B2) DOSY spectrum of γ-CD in the presence of Pc-INH (in Pc-INH/γ-CD molar ration of 1:2), showing the existence of two molecular species with distinctive diffusion coefficients: free and complexed γ-CD (complex).

