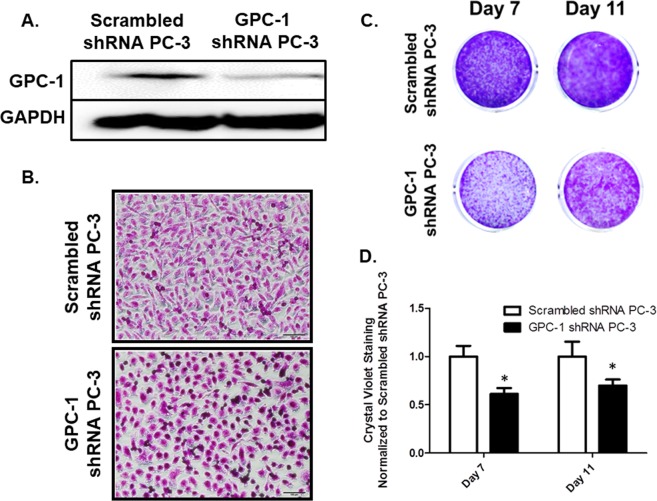
Figure 2.
Effect of GPC-1 Inhibition on Prostate Cancer Cell Growth and Morphology. (A) Effect of GPC-1 shRNA (Genecopoeia, Rockville, MD) on expression of GPC-1 in PC-3 cells. (B) Effect of GPC-1 inhibition on cell morphology visualized by crystal violet staining at high seeding density. (C,D) Changes in cell growth in GPC-1 knockdown PC-3 cells visualized by crystal violet staining after 7 and 11 days of culture (C) followed by quantification (D) Data in (A,C,D) are representative of at least 3 separate experiments with at least 3 independent cell passages. Data in D are presented as the mean ± the S.E.M. of at least 3 (n = 3) separate passages. *Indicates a significant difference (p < 0.05) as compared to control as determined using a Student t-test.

