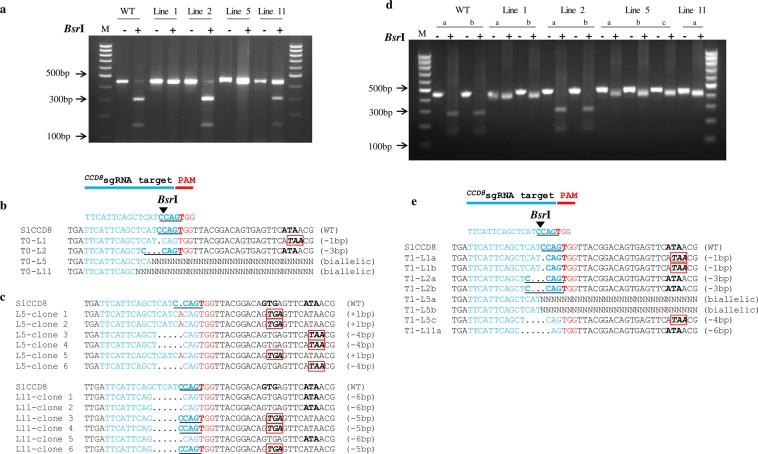
Figure 2.
Restriction analysis and sequence alignment of CCD8Cas9-edited lines. (a) PCR fragments of CCD8Cas9 targeted region in T0 lines from genomic DNA of independent transgenic plants were subjected to BsrI-restriction digestion. Lines 1, 2, 5 and 11 represent independent T0 transgenic plants;+, BsrI added; −, without BsrI. BsrI digested or non-digested PCR product were resolved using a 2% agarose gel for 60 min. Results shown that CCD8Cas9 mutant line 1 and 5 lost the BsrI digestion site, while line 11 shown partial digestion, however line 2 yield bands similar to control wild-type (WT). The full length agarose gel blot represents the complete set of digested or non-digested PCR products run in independent wells of a single gel. Image was acquired using DNR MiniLumi with UV light and Microsoft office was used to crop the image in appropriate size. M: DNA size ladder (100 bp) (b) PCR product sequence alignment of the selected T0 lines with the wild-type genome sequences (WT). PAM is shown in red; BsrI site is shown in bold underlined, black triangle indicates the digestion site for BsrI; DNA deletions are shown in black dots and deletion sizes (nt) are marked on the right side of the sequences. (c) CCD8Cas9 target regions from T0 lines 5 and 11 were amplified by PCR and cloned into the TA cloning vector. Sanger sequencing of positive clones aligned with wild-type sequence, and type of mutation (indels) detected presented on the right side of the sequences. Nucleotide sequence inside red box encode for stop codon. (d) PCR fragments of CCD8Cas9 targeted region in T1 generation from genomic DNA of independent transgenic plants was subjected to BsrI restriction digestion;+, BsrI added; −, without BsrI. BsrI digested or non-digested PCR products were resolved using a 2.5% agarose gel for 60 min. Results shown that CCD8Cas9 mutant line 1, 5 and 11 lost the BsrI digestion site, however line 2 yield bands similar to control wild-type (WT). The full length agarose gel blot represents the complete set of digested or non-digested PCR products run in independent wells of a single gel. Image was acquired using DNR MiniLumi with UV light and Microsoft office was used to crop the image in appropriate size. M: DNA size ladder (100 bp) (e) PCR product sequence alignment of the selected T1 lines. PAM is shown in red; BsrI site is shown in bold underlined, black triangle indicates digestion site for BsrI; DNA deletions are shown in black dots and deletion sizes (nt) are marked on the right side of the sequences; Nucleotide sequence inside red box encode for stop codon.

