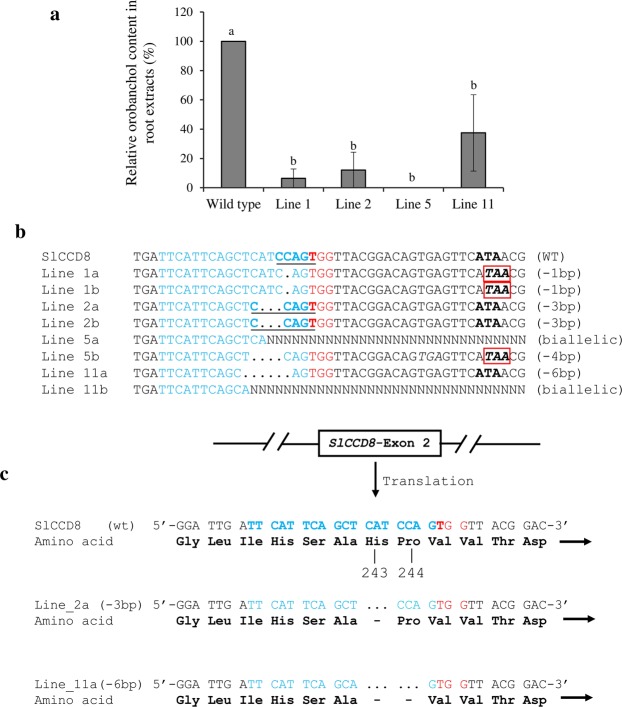
Figure 5.
Orobanchol content, genotyping and amino acid sequence analysis of the CCD8Cas9 mutated T1 plants. (a) Orobanchol contents in the roots of tomato CCD8Cas9 edited lines (1, 2, 5 and 11) as compared to wild type. LC-MS/MS analysis was done with two independent biological samples from each line. Data presented as average ± SE. (b) PCR product sequence alignment of CCD8Cas9 edited lines (1, 2, 5 and 11) used for LC–MS/MS analysis. PAM is shown in red; BsrI site shown in bold underlined; DNA deletions are shown in black dots and deletion sizes (nt) are marked on the right side of the sequences; Nucleotide sequence inside red box encode for stop codon. (c) Amino acid sequences for line 2a (His-243 deletion) and line 11a (His-243 and Pro-244 deletion) compared to wild-type (WT) CCD8 proteins.

