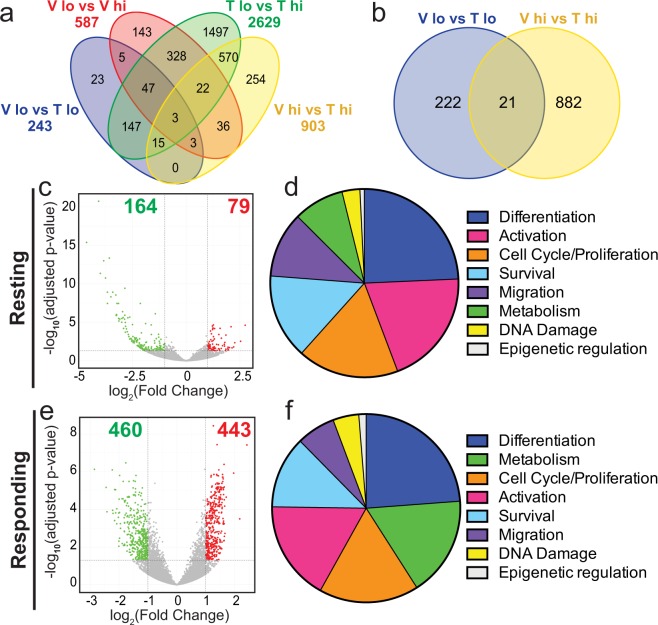
Figure 2.
Developmental exposure to TCDD alters gene expression in CD4+ T cells following IAV infection. (a) 4-way and (b) 2-way Venn diagrams of differentially expressed genes (DEGs). Comparison groups are as follows: Blue- Vehicle CD44lo vs. TCDD CD44lo; Red- Vehicle CD44lo vs. Vehicle CD44hi; Green- TCDD CD44lo vs. TCDD CD44hi; Yellow- Vehicle CD44hi vs. TCDD CD44hi. (c,e) Volcano plots depict DEGs that are down-regulated (green dots) and up-regulated (red dots) by developmental exposure to TCDD in resting (CD44lo, c) and responding (CD44hi, e) CD4+ T cells compared to vehicle controls. (d,f) For these same comparisons, Ingenuity Pathways Analysis (IPA) was used. Predicted pathways were grouped by cellular function, and pie charts represent the number of pathways that were associated with differentiation, activation, cell cycle/proliferation, survival, migration, metabolism, DNA damage, or epigenetic regulation. The most represented cellular functions are listed in descending order in resting (CD44lo, d) and responding (CD44hi, f) CD4+ T cells.

