Figure 3.
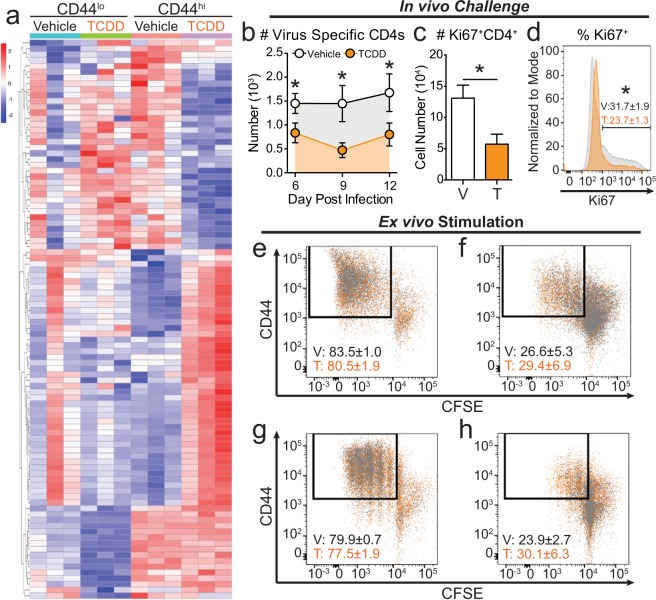
TCDD exposure during development impairs in vivo CD4+ T cell proliferation. (a) IPA predicted pathways involved in cellular proliferation. The heat map shows genes that are differentially expressed following developmental AHR activation in resting and responding CD4+ T cells. Genes were ordered using unsupervised clustering by row. See Supplemental Table 2 for gene list. (b–d) Adult offspring from Vehicle (V) and TCDD (T) exposed dams were infected with IAV. (b) Virus specific CD4+ T MLN cells were enumerated using flow cytometry on days 6, 9, and 12 post-infection using MHCII tetramers (I-Ab/NP311–325). (c,d) Proliferating Ki67+CD4+ T cells were assessed on day 9 post-infection. Bar graph shows the (c) number in vehicle (white bar) and TCDD (orange bar) groups. The histogram shows the (d) percentage of CD4+ T cells that are Ki67+ in vehicle (grey histogram) and TCDD (orange histogram) mice. (e–h) CD4+ T cells were isolated from peripheral lymph nodes of naïve vehicle (grey dots) and TCDD (orange dots) developmentally exposed animals. Cells were stained with CFSE and stimulated in culture for (e,f) four or (g,h) three days with (e,g) 5 μg/mL or (F,H) 2.5 μg/mL of α-CD3/α-CD28. All values are mean ± SEM. At each point in time, all offspring within the same group were from a separate dam, and there were 6–8 female offspring per exposure group per day. Experiments were repeated at least once with similar results. An * signifies a p-value ≤ 0.05 by Student’s t-test.

