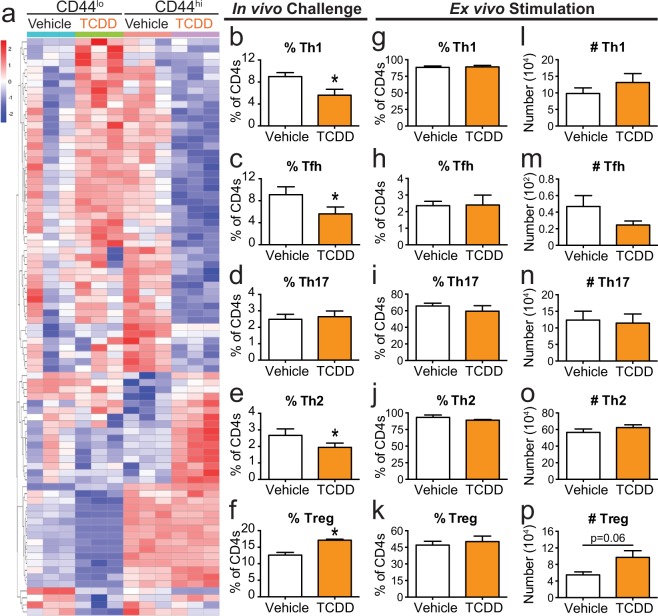
Figure 4.
CD4+ T cells from mice developmentally exposed to TCDD do not have a differentiation defect in culture. (a) Heat map shows differentiation related DEGs. Genes are ordered using unsupervised clustering by row. See Supplemental Table 3 for gene list. (b–f) Offspring that were developmentally exposed to vehicle or TCDD were infected with IAV at maturity. On day 9 post-infection, the percentage of CD4+ T cells subsets were quantified. All subsets were gated on CD4+ cells, and further defined as: (b) Th1 Tbet+, (c) Tfh CD44hiCXCR5+PD1+, (d) Th17 RORγt+, (e) Th2 GATA3+, and (f) Treg Foxp3+CD25+. (g–p) CD4+ T cells from naïve offspring were cultured ex vivo in conditions that have been optimized to drive them toward one of these subsets. After 5 days in culture, cells were stained with fluorescent antibodies and flow cytometry was used to evaluate differentiation. (g–k) Bar graphs show the (g) percent of Th1, (h) Tfh, (i) Th17, (j) Th2, and (k) Tregs. (l–p) Bar graphs shows the number of (l) Th1, (m) Tfh, (n) Th17, (o) Th2, and (p) Tregs. Offspring from 5–7 separate dams were used per treatment group for each experiment, and experiments were repeated at least once with similar results. Values are mean ± SEM. An * signifies a p-value ≤ 0.05 by Student’s t-test.

