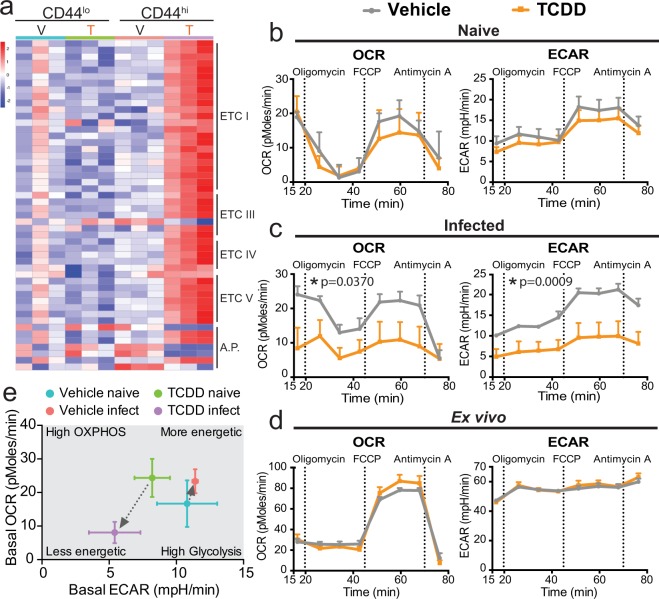
Figure 5.
Developmental exposure to TCDD impairs mitochondrial metabolism in CD4+ T cells following an immune challenge later in life. (a) Heat map of genes that are differentially expressed following developmental AHR activation in resting and responding CD4+ T cells that are involved in the electron transport chain (ETC). Genes are clustered in order of ETC complex. A.P. stands for ETC accessory proteins. See Supplemental Table 4 for the list of DEGs. (b–d) A Seahorse XFe analyzer was used to measure the oxygen consumption rate (OCR) and extracellular acidification rate (ECAR). Vertical dashed lines denote the addition of the indicated drug to the system. (b) CD4+ T cells were purified from naïve developmentally exposed mice and assayed immediately. (c) CD4+ T cells were purified from the MLNs 9 days after IAV infect infection. Cells were assayed immediately after purification. (d) CD4+ T cells were isolated from naïve mice, activated ex vivo with α-CD3/CD28, and assayed 5 days later. OCR and ECAR data are normalized to cell input (all wells contained 2 × 10⁵ CD4+ T cells). (e) Bioenergetics plot of basal OCR (y-axis) and basal ECAR (x-axis) of CD4+ T cells from naïve and IAV infected mice. For each experiment, 3–6 offspring from separate dams were used per treatment, and experiments were repeated at least once with similar results. All values are mean ± SEM. An * signifies a p-value ≤ 0.05 by univariate repeated-measures ANOVA.

