Figure 5.
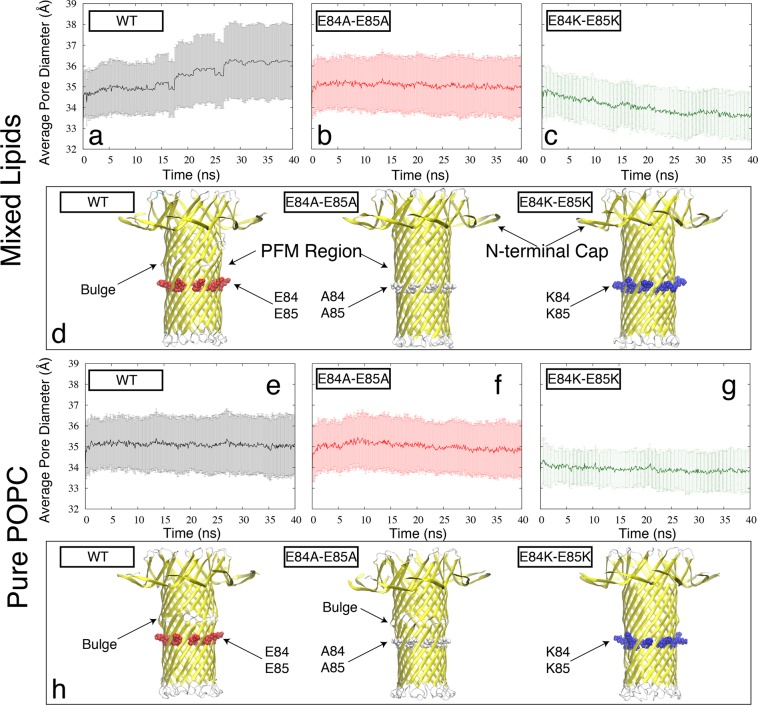
The MD based PFM dynamics quantified by the time series of PFM diameter (see Materials and Methods) for the (a) wild-type, (b) E84A E85A mutant, and (c) E84K E85K mutant lysenin embedded in the mixed lipids and for the (e) wild-type, (f) E84A E85A mutant, and (g) E84K E85K mutant lysenin embedded in the pure POPC lipids. The error bars represent the standard deviation of the pore diameter along the PFM pore. A representative snapshot of the PFM region along with the N-terminal Cap is shown for each system in cartoon representation in panels (d) and (h), for mixed and pure lipids, respectively.

