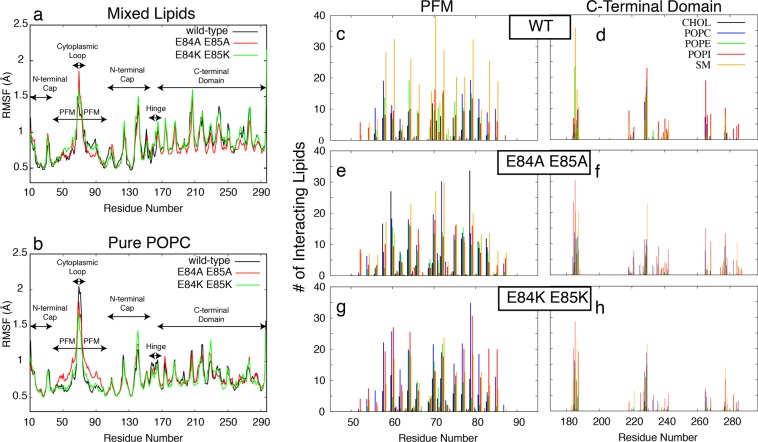
Figure 6.
(a,b) The RMSF of Cα atoms of all residues averaged over 9 protomers calculated from 40- ns MD trajectories for the wild-type (black), E84A E85A mutant (red), and E84K E85K mutant (green) lysenin embedded in mixed lipids (a) and pure POPC lipids (b). (c–h) The number of lipids interacting with different residues of the PFM region (c,e,g) and the C-terminal domain (d,f,h), averaged over 40-ns MD trajectories are shown for different lipid types including CHOL (black), POPC (blue), POPE (green), POPI (red), and SM (orange).

