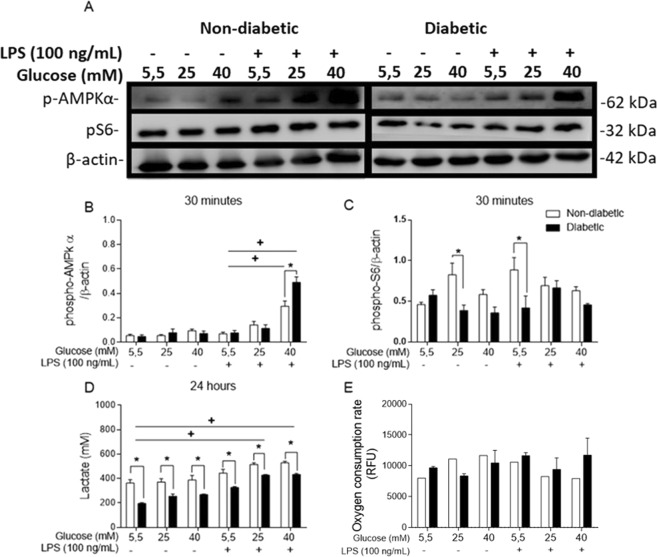
Figure 3.
Hyperglycaemia alters the energy metabolism of BMDMs. (A) Western blot membranes probed with anti-mouse AMPK, anti-mouse pS6 and anti-mouse β-actin primary antibodies. (B) Phospho-AMPK/β-actin ratio. (C) Phospho-S6/β-actin ratio. (D) Lactate release after 24 hours of incubation. (E) Oxygen consumption during the first hour of incubation. *p < 0.05 compared to normoglycaemic BMDMs, +<0.05 compared with control glucose medium. The images of the gels were cropped, with full-length blots/gels presented in Supplementary Fig. S1. The samples were derived from the same experiment, and the gels/blots were processed in parallel. Data are presented as the means ± SEM (N of at least 3).

