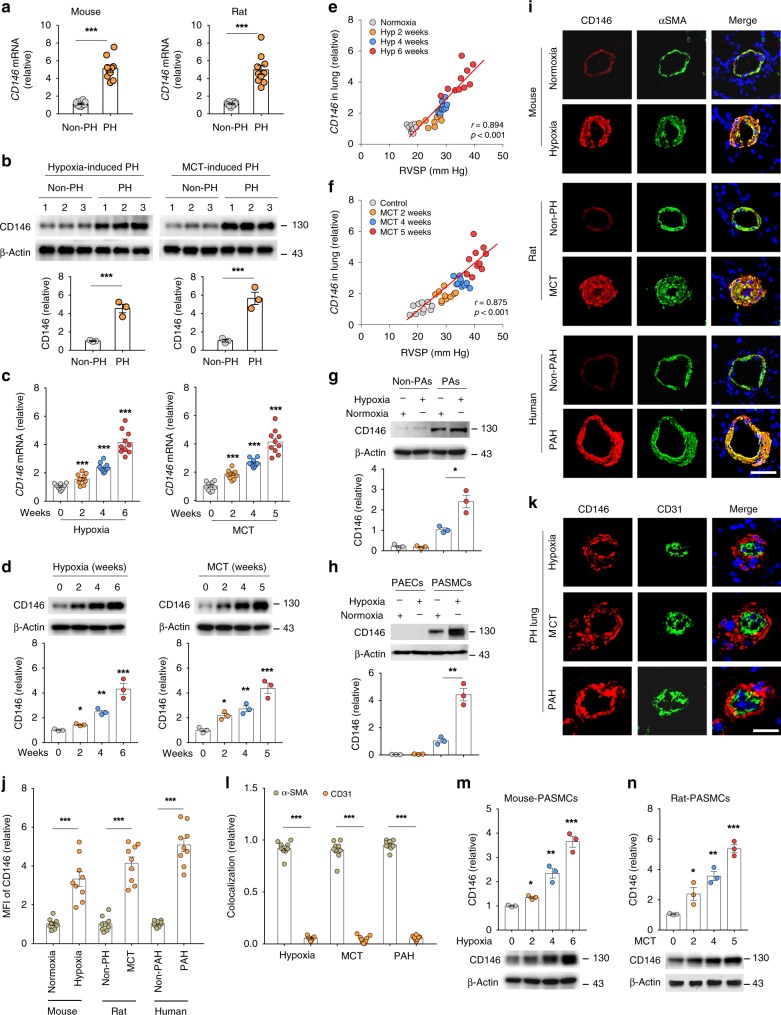
Fig. 1.
CD146 elevation in PASMCs correlates with PH severity. a, b CD146 mRNA a or protein b expression in lungs with hypoxia-induced PH in mice and with MCT-induced PH in rats. Below in b, relative CD146 expression. c, d CD146 mRNA c or protein d expression in the lungs of mice during development of hypoxia-induced PH or of rats during development of MCT-induced PH. Below in d, relative CD146 expression. n = 3 b, d or n = 10 a, c lungs for each group. e, f Pearson comparison analyses showing the correlation between Cd146 mRNA levels (normalized to β-actin) in lung tissues and RVSP of mice during development of hypoxia-induced PH e or of rats during development of MCT-induced PH f (n = 10 animals for each time point). g, h Top, mice were exposed to hypoxia for 4 weeks. The expression of CD146 in PAs and non-PAs fractions g or in isolated PAECs and PASMCs h was detected by western blotting (WB). Bottom, quantification of CD146 expression (n = 3 independent experiments). i–k Representative immunofluorescence of CD146 (red) and αSMA (green) i or CD31 (green) k in small pulmonary arteries from mouse, rat and human lungs without or with PH. Nuclei are counterstained with DAPI (blue). Scale bars, 50 μm. The images are representative of nine arteries per group. j Quantification of the mean fluorescent intensity (MFI) of CD146 (n = 9 arteries per group). l Quantification of the colocalization of CD146 and αSMA signal or CD146 and CD31 signal in i and k. m, n Bottom, CD146 protein expression in PASMCs isolated from mice during development of hypoxia-induced PH m or from rats during development of MCT-induced PH n. Top, relative CD146 expression (n = 3 independent experiments). In all statistical plots, the results are expressed as mean ± s.e.m. P < 0.05, **P < 0.01, ***P < 0.001. One-way ANOVA with Bonferroni post hoc analysis a–c or two-tailed Student’s t test d, g, h, j, l, m, n. All WB represent data from three b, d, g, h, m, n independent experiments. Source data are provided as a Source Data file

