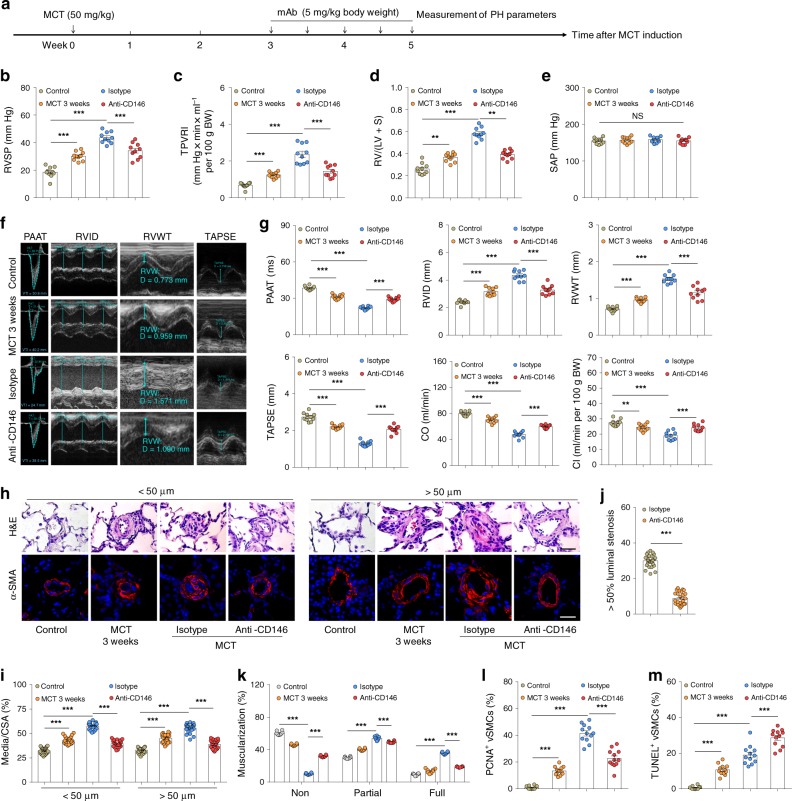
Fig. 7.
Targeting CD146-HIF-1α axis attenuates MCT-induced PH in rats. a Schematic of CD146-targeted therapy in MCT-induced PH in rats. b–e RVSP b, TPVRI c, SAP d and RV/(LV + S) e in anti-CD146- or mIgG-treated rats after 5 weeks of MCT (n = 10 rats per group). f Echocardiographic (PAAT, RVID, RVWT, and TAPSE) measurements and images. g Echocardiography measurements were carried out on anti-CD146- or mIgG-treated rats after 5 weeks of MCT to determine PAAT, RVID, RVWT, TAPSE, CO, and CI (n = 10 rats per group). h Representative images of H&E and immunofluorescent staining of PAs (20–50 μm or 51–100 μm in diameter) stained with αSMA (green). Scale bar, 50 μm. i Quantification of vascular medial thickness for images in h (n = 5 rats per group, five PAs per rat). j Quantification of PAs with >50% luminal stenosis (n = 5 rats per group, five PAs per rat). k Proportion of non-, partially-, or fully- muscularized pulmonary arterioles (20–50 μm in diameter) from MCT-treated rats (n = 8 rats per group). l Quantification of the relative number of PCNA+/αSMA+ cells (n = 4 rats per group, three PAs per rat). m Quantification of the number of TUNEL+ cells (n = 4 rats per group, three PAs per rat). In all statistical plots, the results are expressed as mean ± s.e.m. *P < 0.05, **P < 0.01, ***P < 0.001. n.s., not significant; one-way ANOVA with Bonferroni post hoc analysis b–e, g or two-tailed Student’s t test i–m. Source data are provided as a Source Data file

