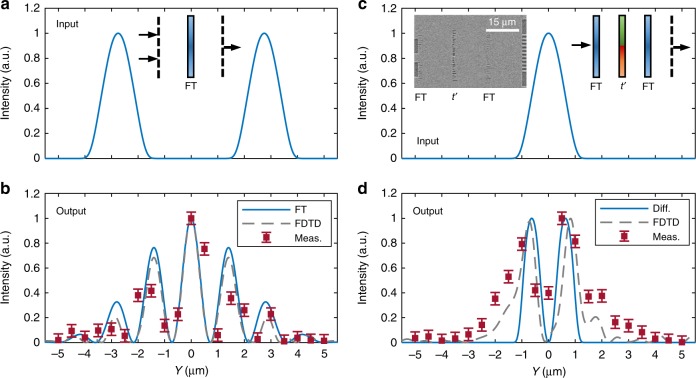
Fig. 4.
Mathematical operation with cascaded HCTA. a The input and b output of an on-chip Fourier Transform (FT) system. The inset of a shows the schematic design of the system (30-μm long). The error bars represent the s.d. for three measurements. c The input and d output of an on-chip differentiator (45-μm long). The insets of c show the schematic diagram and correspondent layout of the device. The measurement result (red squares in b, d) is compared with the FDTD simulated profile (gray dashed curve) and analytical results (blue solid curve). The error bars represent the s.d. for three measurements

