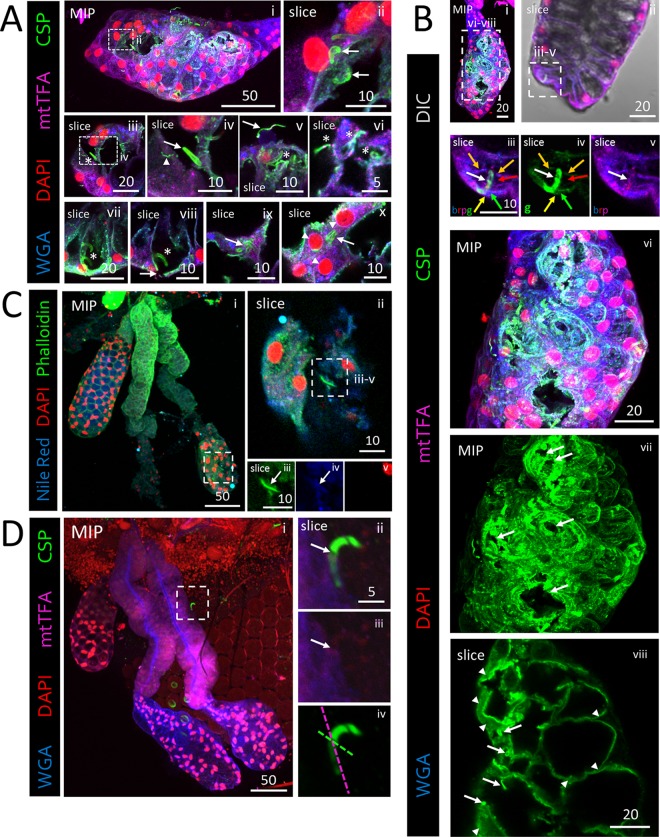
FIG 3.
Salivary gland basement membrane and secretory cell traversal by sporozoites (SPZs) is associated with changes in the invasion and motility protein CSP. Representative 3D projection (MIP) or single-slice (slice) confocal microscopy images from salivary glands (SGs) stained with DAPI (DNA, red), either WGA (A, B, and D; chitin [O-GlcNAcylation], blue) or Nile red (C; lipids, blue), and either antisera against CSP (A, B, and D; SPZ protein, green) and mtTFA (A, B, and D; mitochondria, purple) or phalloidin (C; actin, green) 22 (A, B, and D) or 24 (C) days postinfection with P. berghei are shown. Scale bar length units are micrometers. (A) Distal lateral lobe showing large basement membrane disruptions (panel i) and rounded, likely dead parasites (panel ii). The examples shown represent cellular invasions and egressions by SPZs (panels iii to ix, asterisks). Three distinct CSP morphologies were observed: thick CSP SPZ coat (panel iv, arrow), thin CSP SPZ coat (panel v, arrow), and smaller tracks of shed CSP (panel iv, arrowhead). Thin CSP-coated SPZs are shown in secretory cavities (panel vi, asterisks). Thick CSP-coated parasites were observed invading secretory cells through the secretory cavities (panels vii and viii, asterisks) with a nearby basement membrane/cell disruption (panel viii, arrow). Rare SPZs with thick CSP coats were observed within damaged, dysmorphic SG secretory cell cytoplasms (panels ix and x, arrows). Perinuclear mtTFA enrichment in invaded cells is indicated (panel x, asterisks). (B) Low-magnification and high-magnification images of an infected distal lobe. A single SPZ (panel iii, white arrow) captured crossing the SG basement membrane (panels iii and iv, yellow arrow), a secretory cell cytoplasm (panels iii and iv, green arrow), a secretory cavity (panels iii and iv, red arrow), and lateral cytoplasmic extensions, which define the sides of the secretory cavity, of that cell and a neighboring cell (panels iii and iv, orange arrows) is shown. Contrast was uniformly enhanced in panel iv to highlight CSP and the SG cellular contents (WGA, mtTFA) associated with the invading sporozoite (panel v, white arrow) extending into the secretory cavity. Large basement membrane disruptions and large accumulations of shed CSP are shown (panels vi and vii, arrows). SPZs (panel viii, arrows) and CSP accumulations (panel viii, arrowheads) are observable. (C) Low-magnification image of a DL (panel i) with a SPZ (panels ii to iv) inside the lumen associated with a molecular halo (panels iii and iv, white arrow) that included Nile red and phalloidin staining accumulations. (D) Low-magnification image of SGs with only a few surrounding SPZs (panel i). Images of a single SPZ during invasion show that CSP staining was highly reduced beginning at the likely point of invasion (panels ii and iii, arrow). The basement membrane (purple dashed line) and plane of invasion (green dashed line) are indicated (panel iv).

