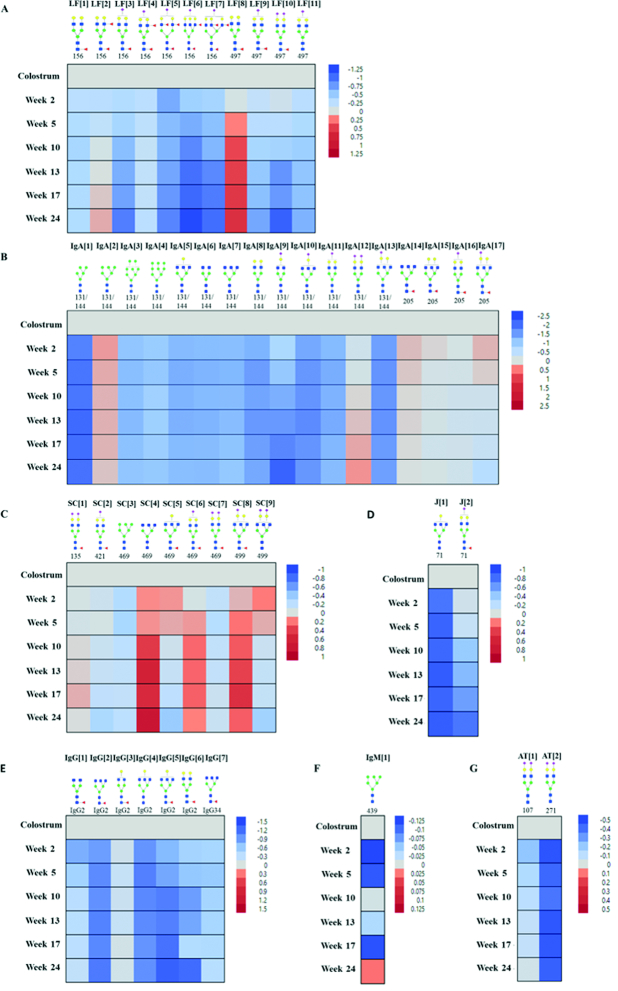
FIGURE 4.
Variations in site-specific glycosylation across lactation of selected glycoproteins: (A) lactoferrin, (B) heavy chain of IgA, (C) secretory component of IgA, (D) J chain, (E) IgG, (F) IgM, and (G) α-antitrypsin. Blue squares, green circles, yellow circles, red triangles, and purple diamonds represent N-acetylglucosamine, mannose, galactose, fucose, and sialic acid, respectively. Data are reported as log value (mean) of fold change relative to colostrum, n = 33. AT, α-antitrypsin; J, J chain; LF, lactoferrin; SC, secretory component.

