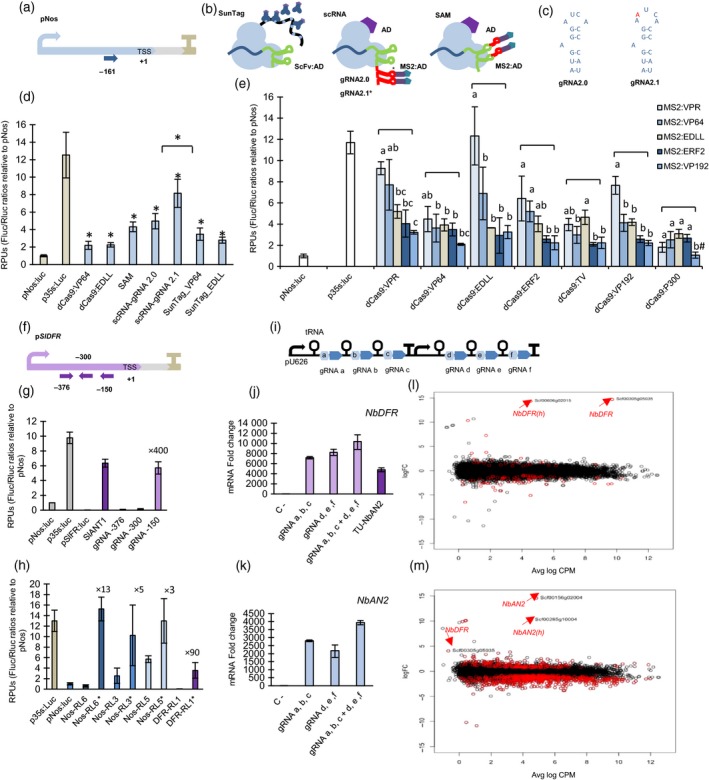
Figure 1.

(a) Representation of Nos promoter with a gRNA target at position −161. (b) Schematic representation of SunTag, scRNA (gRNA2.0 or gRNA 2.1) and SAM strategies. Asterisk indicates the mutation position in gRNA2.1. (c) Representation of the MS2 aptamer loop in 2.0 and 2.1 variants. (d) Relative transcriptional activities (RTAs) obtained with different dCas9‐PTAs strategies. All SAM and scRNA strategies combine direct dCas9‐EDLL fusions with gRNA aptamers attached to MS2‐VP64. RTAs of pN os and p35S reporters measured in the same example are also included as a reference. Asterisks indicate Student's t‐test significant values (P < 0.05). (e) RTAs obtained upon activation with different combinations of TADs using scRNA‐gRNA 2.1 strategy, targeting the reporter pNos:Luc at position −161. ANOVA test was performed for each dCas9‐PTA group. Bars sharing the same letter are not significantly different according to Tukey's HSD test (P < 0.05). The # symbol indicates no statistical differences with the control sample. (f) Representation of the reporter pSlDFR:Luc with gRNAs targeted at positions −150, −300 and −376. (g) Reporter RTAs measured in leaves transiently transformed with pS lDFR:Luc alone or in combination with SlANT1 or dCasEV2.1 targeting positions −150, −300 and −376 of pS lDFR. (h) RTAs measured in transgenic lines containing stably transformed pN os and pS lDFR‐driven reporters. The pN os reporter lines (Nos‐RL) were activated by targeting the pN os promoter at positions −161 and −211. DFR‐RL5 line was activated by targeting the pS lDFR promoter at position −150. Asterisk labels indicate the presence of functional dCasEV2.1 activator as compared with nonactivated control samples. (i) Representation of the multiplexing strategy for dCasEV2.1 activation. (j) mRNA fold change at 4 dpi obtained by targeting the endogenous gene NbDFR with dCasEV2.1 using the multiplexing strategy. The depicted gRNAs target pN bDFR promoter at the positions: a (−88), b (−125), c (−217), e (−198) and f (−248). (k) mRNA fold change at 4 dpi obtained by targeting the endogenous NbAN2 gene with dCasEV2.1 using a multiplexing gRNA strategy. The gRNAs a‐f were designed to target the promoter of NbAN2 at the following positions: a (−103), b (−175), c (−196), d (−145), e (−198) and f: (−252). (l) Differential gene expression plot between the dCasEV2.1–NbDFR condition and control condition. (m) Differential gene expression plot between the dCasEV2.1–NbAN2 condition and control condition. Bars represent average RTAs ± SD, n = 3 in all experiments.
