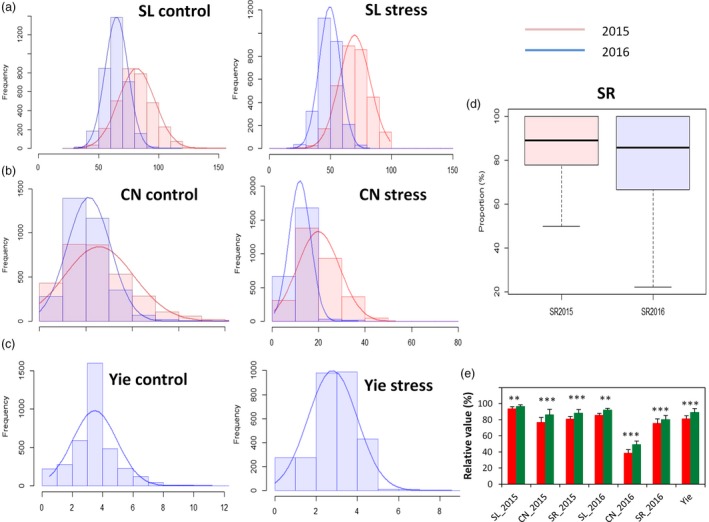
Figure 1.

Frequency distribution and boxplot of the mean values for drought tolerance traits in 400 Sesamum indicum accessions under control and water stress conditions during 2015 and 2016. (a) stem length (SL) in control and water stress. (b) Capsule number (CN) in control and water stress. (c) Seed yield (Yie) in control and water stress. (d) Survival rate (SR) of the plants. (e) Comparison of drought tolerance indexes between the subpopulation from the tropical area (coloured in green, 292 accessions) and the subpopulation from the northern area (coloured in red, 108 accessions). **, *** represent a significant difference between the two groups at P < 0.01, 0.001, respectively.
