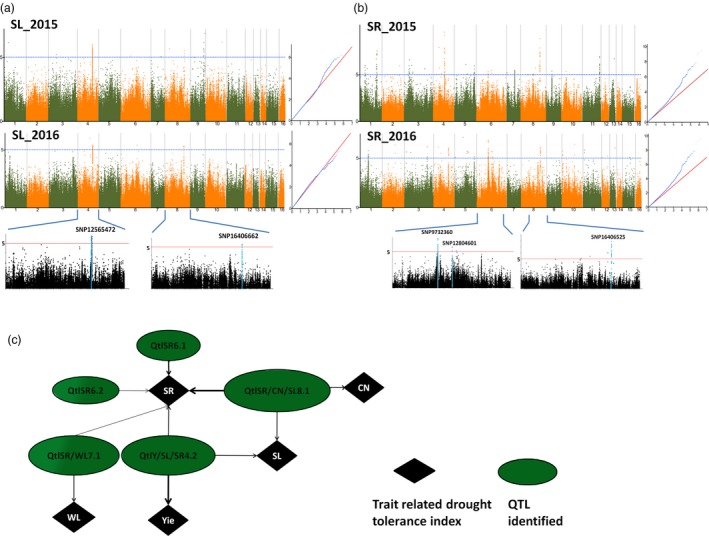
Figure 2.

Significant loci and quantitative trait loci (QTLs) associated with SL index and SR detected by the genome‐wide association study using the Mixed model in Sesamum indicum during 2015 and 2016. (a) Manhattan plot and QQ plot of SL. The significant trait‐associated QTLs constitutively identified on LG4 and LG8 for the 2 years are highlighted in blue in the regional plots with the names of the lead locus placed on the top. (b) Manhattan plot and QQ plot of SR. The significant trait‐associated QTLs constitutively identified on LG6 and LG8 for the 2 years is highlighted in blue in the regional plots with the names of the lead locus placed on the top. (c) The network based on shared QTLs between different drought tolerance indexes in sesame. The width of the arrow depicts the amplitude of the QTL contribution to the trait.
