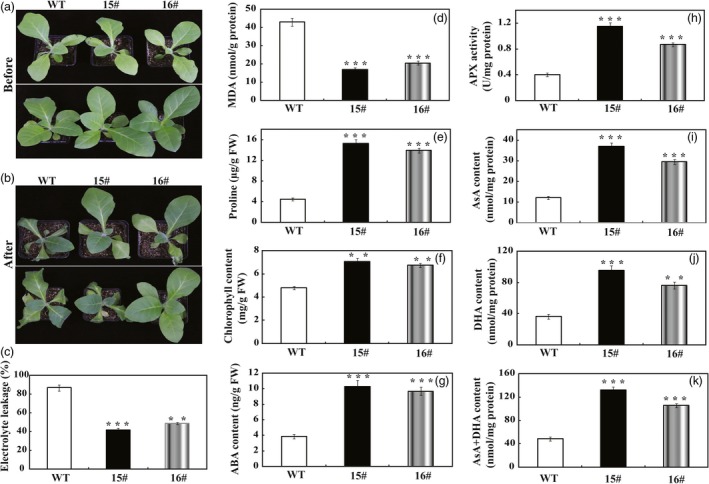
Figure 4.

Phenotype and drought tolerance of wild type (WT) and transgenic lines (15# and 16#). (a and b) Representative photographs of potted plants of WT, 15# and 16# that have been exposed to water stress for 0 day (a) and 15 days (b). (c–f) Electrolyte leakage (c), MDA levels (d), proline contents (e) and total chlorophyll content (f) of WT, 15# and 16# after 15 days of water stress. (h–k) Analysis of APX content (h), ascorbic acid content (i), dehydroascorbate (DHA) content (j) and AsA + DHA content (k) of transgenic lines and WT after drought stress. The data were analysed by Duncan's multiple range tests in the ANOVA program of SPSS (IBM SPSS 22). ** and *** indicate that values of the two transgenic lines were significantly different from those of WT at P < 0.01 and P < 0.001, respectively.
