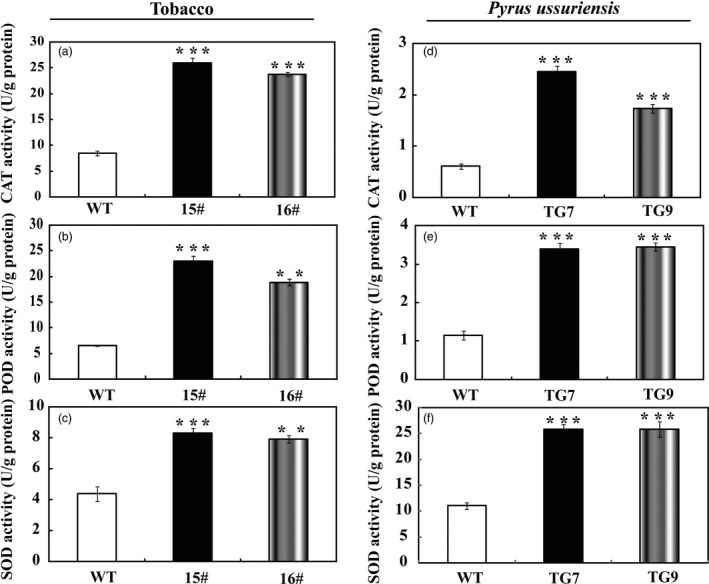
Figure 7.

Analysis of antioxidant enzymes activities in tobacco and Pyrus ussuriensis. (a–c) Activity of CAT (a), POD (b) and SOD (c) in tobacco WT and transgenic lines (15# and 16#) before and after drought treatment. (d–f) Activity of CAT (d), POD (e) and CAT (f) in P. ussuriensis WT and transgenic lines (TG7 and TG9) before and after drought stress. The data were analysed by Duncan's multiple range tests in the ANOVA program of SPSS (IBM SPSS 22). ** and *** indicate that values of the two transgenic lines were significantly different from those of WT at P < 0.01 and P < 0.001, respectively.
