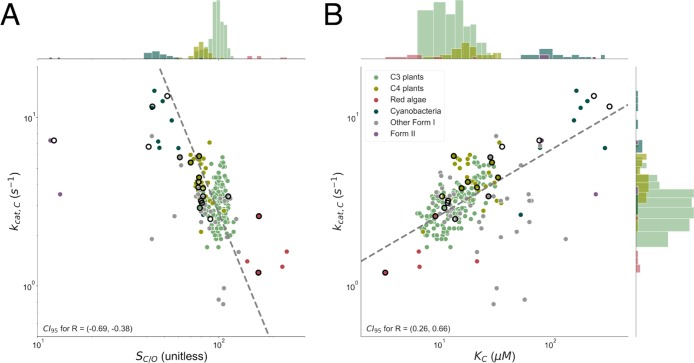
Figure 5.
Focal correlations of previous analyses are not robust to new data. Points with black outlines are from ref (6), and dashed gray lines represent the best fit to FI Rubisco data. Histograms for kcat,C, SC/O, and KC are plotted on parallel axes. Panel A plots kcat,C against SC/O. kcat,C and SC/O correlate with an R of approximately −0.6 among FI Rubiscos as compared to ≈0.9 previously.5,6 The 95% confidence intervals are (−4.0, −2.0) for the fit exponent and (3 × 10⁴, 2 × 10⁸) for the prefactor (slope and intercept on a log–log scale, respectively), indicating that the form of kcat,C–SC/O correlation is very uncertain. Notably, SC/O displays very limited variation overall and especially within physiological groupings with sufficient data. Median SC/O values are 177 for red algae (σ* = 1.2; N = 6), 98 for C3 plants (σ* = 1.1; N = 162), 80 for C4 plants (σ* = 1.1; N = 35), and 48 for cyanobacteria (σ* = 1.1; N = 16). Panel B plots kcat,C against KC. Here, the R is ≈0.5 as compared to ≈0.9 previously.6 This fit is more robust, with 95% confidence intervals of (0.3, 0.5) and (0.8, 1.5) for the fit exponent and prefactor, respectively.

