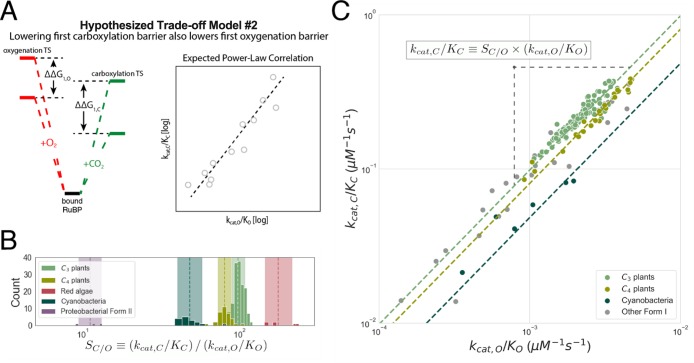
Figure 7.
Second mechanistic proposal that is remarkably well-supported by the extended data set. (A) In this proposal, mutations increasing the rate of addition of CO2 to the Rubisco–RuBP complex also increase the rate of O2 addition. In energetic terms, lowering the effective barrier to enolization and CO2 addition (ΔG1,C) lowers the first effective barrier to O2 addition (ΔG1,O), as well. Given this model, barrier heights should be positively correlated, which would manifest as a positive linear correlation on a log–log plot of kcat,C/KC against kcat,O/KO. (B) SC/O displays limited variation within physiological groups such as C3 and C4 plants for which we have substantial data. Dashed lines give the geometric mean of SC/O values. The multiplicative standard deviation, σ*, sets the width of the shaded region. (C) SC/O = (kcat,C/KC)/(kcat,O/KO), so restricted SC/O variation implies a power-law relationship (kcat,C/KC) = SC/O(kcat,O/KO). kcat,C/KC is strongly correlated with kcat,O/KO on a log–log scale (R = 0.94; p < 10–10). Fitting FI measurements gives kcat,C/KC = 119(kcat,O/KO)1.04. A 95% confidence interval for the exponent is (0.94, 1.13), which includes 1.0. The geometric mean of measured SC/O values predicts kcat,O/KO = (kcat,C/KC)/SC/O and vice versa. This simple approach accurately predicts the kcat,O/KO for FI Rubiscos (prediction R2 = 0.80), C3 plants (R2 = 0.84), C4 plants (R2 = 0.96), and cyanobacteria (R2 = 0.79). Other groups, e.g., red algae, are omitted because of insufficient data.

