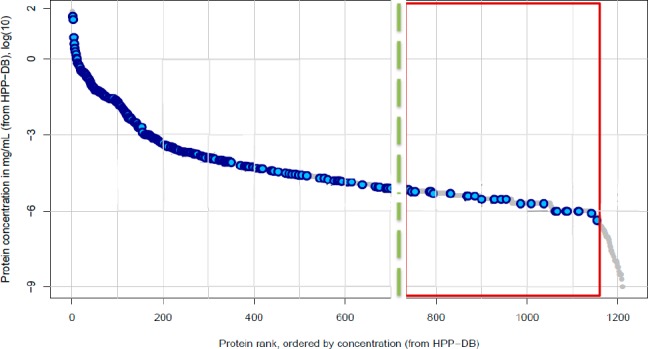
Figure 4.

Graphical depiction of the waterfall plot: the waterfall plot lists all proteins, starting with the most-concentrated ones down to the least concentrated ones. Each blue dot indictes that the protein was found in the sample. The waterfall plot shown here is from the condition with serum +6.9 mg/mL NaCl + nanodiamonds. The dotted green line shows the detection limit for the control. All the proteins in the red square are only accessible with our sample preparation method.
