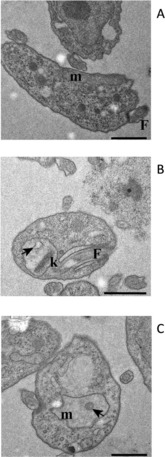
Figure 7.

Ultrastructure TEM images of untreated (A) and treated (B, 4 h; C, 8 h) s427WT BSF with 22 at 1×EC50. m: mitochondrion, N: nucleus, F: flagellum, k: kinetoplast, arrow: membranous structure within the mitochondrion matrix. Scale bars: 1 μm.
