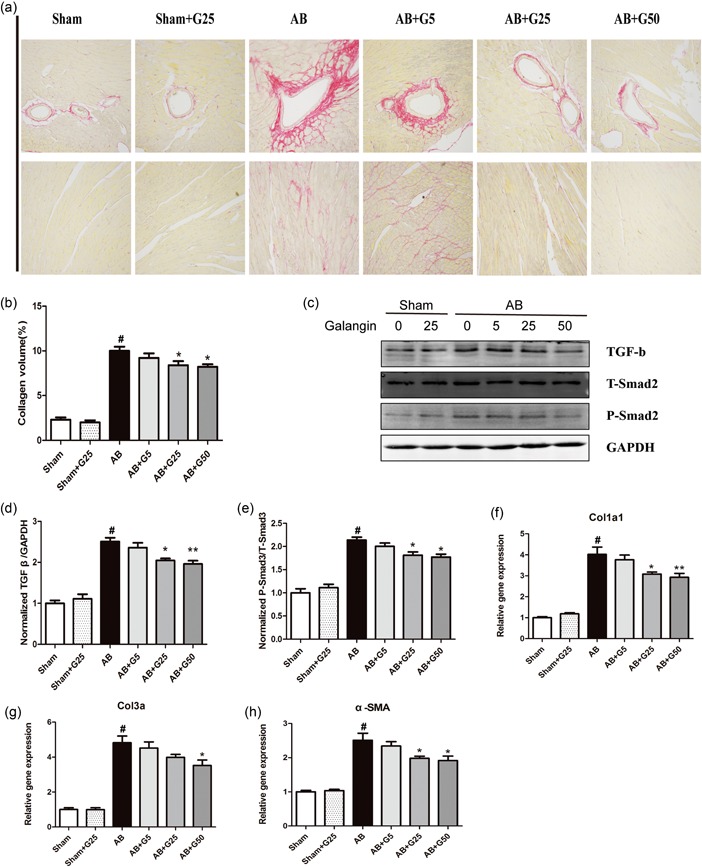
Figure 2.

Galangin attenuated cardiac fibrosis induced by pressure overload in vivo. (a,b) Representative PSR staining on histological sections of the LV and the statistical results (6 = 5). (c–e) Representative blots of TGF‐β1, Smad2 phosphorylation, and Smad2 from indicated groups (n = 6). (d) Real‐time PCR analyses of fibrosis‐related genes (n = 6). # p < 0.05 versus Sham group; *p < 0.05 or **p < 0.01, versus AB group. AB: aortic banding; LV: left ventricle; PCR: polymerase chain reaction; PSR, Picro‐Sirius red; TGF‐β1: transforming growth factor β1; α‐SMA: α‐smooth muscle actin [Color figure can be viewed at wileyonlinelibrary.com]
