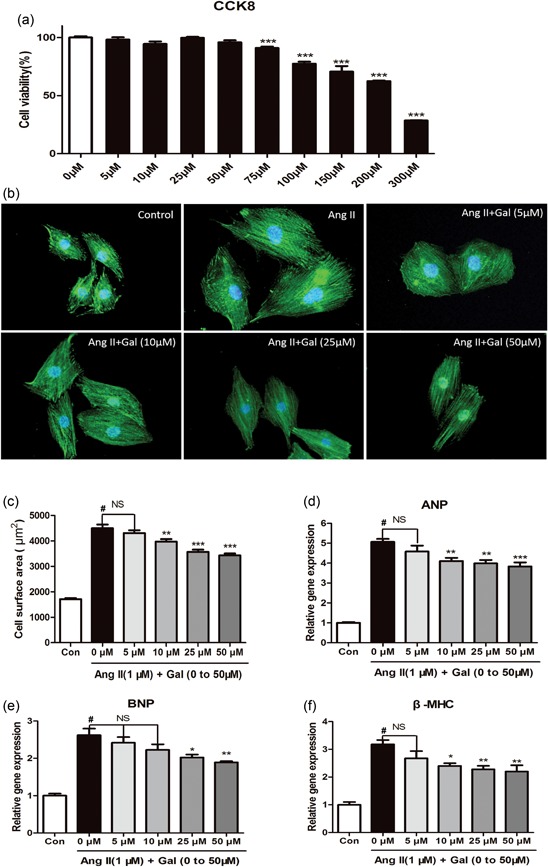
Figure 3.

Galangin suppresses Ang II‐induced H9c2 cardiomyocyte hypertrophy. (a) Cell viability was accessed by the Cell Counting Kit‐8 assay. Cell Counting Kit‐8 assay was used to detect the cell viability of H9c2 cells in different concentrations (0, 5, 10, 25, 50, 75, 100, 150, 200, and 300 μM) of galangin (n = 6). (b, c) Immunofluorescence staining of α‐actinin and the cell surface area of H9c2 cells in the indicated groups (n = 6 samples, and 100 + cells per group). (d, f) H9c2 cells were stimulated with 1 μM Ang II and treated with galangin (0, 5, 10, 25, and 50 mM). The mRNA levels of ANP, BNP, and β‐MHC in H9c2 cells in each group (n = 6). # p < 0.05 versus Sham group or control group; *p < 0.05 or **p < 0.01, versus AB or Ang II group. AB: aortic banding; Ang II: angiotensin II; CCK8: Cell Counting Kit‐8; mRNA: messenger RNA [Color figure can be viewed at wileyonlinelibrary.com]
