Figure 5.

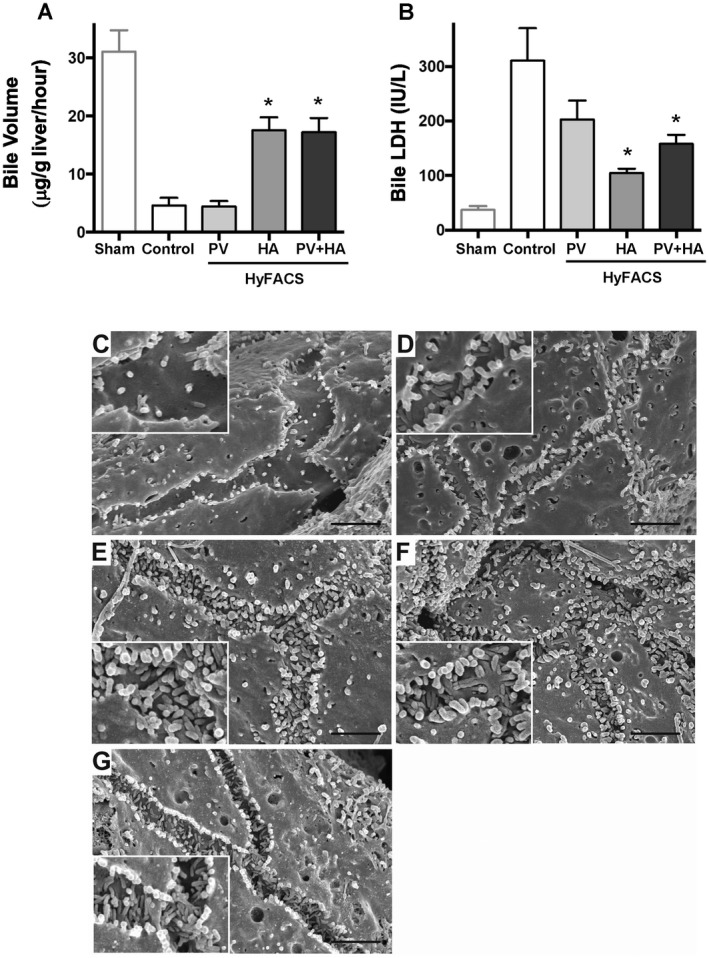
Bile production and biliary damage upon reperfusion. (A) Bile production during 2 hours of reperfusion was used as a comprehensive parameter for liver graft function. One‐way ANOVA (P < 0.001) followed by Bonferroni’s posttest. *P < 0.05 versus control group (mean ± standard error of the mean, n = 10 each). (B) LDH leakage into bile as an indicator for biliary damage. Intergroup difference by 1‐way ANOVA (P < 0.01) and Bonferroni’s posttest. *P < 0.05 versus control group. (C‐G) The ultrastructural observation for the bile canaliculi using SEM. The original magnification was ×13,000. The scale bar in each panel represents 2 μm. (C) In the controls, ultrastructural architecture of microvilli formation in the bile canaliculi was severely injured, and only sparse microvilli were left after prolonged CS and oxygenated reperfusion. The height of the microvilli was also lowered. (D) Portal HyFACS also better maintained microvilli than in the controls but worse than in arterial HyFACS. (E and F) In contrast, microvilli formation was well preserved by arterial HyFACS, where both density and height looked almost intact. (G) Bile canaliculi in sham livers, not cold‐stored but subjected to 2‐hour oxygenated reperfusion, served as a reference for baseline comparison with the 4 experimental groups.
