Figure 6.

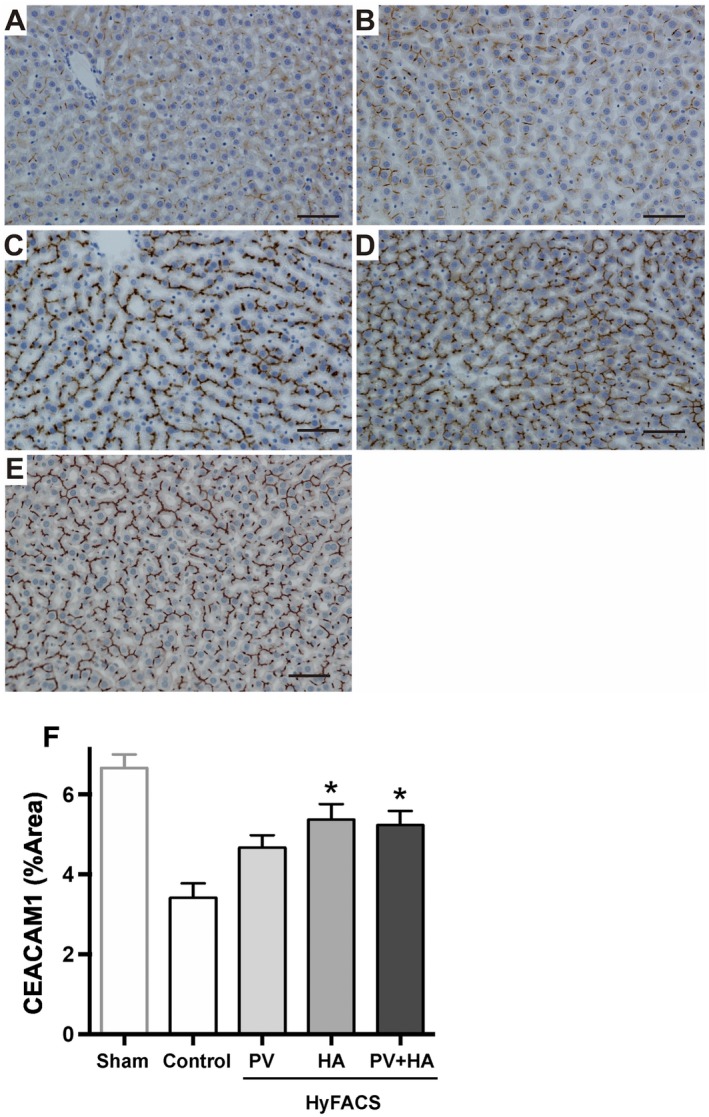
Immunohistochemistry for CEACAM1. Light microscopic appearance of immunohistochemical staining for CEACAM1. Scale bar in each panel indicates 100 μm. (A) Control livers showed weak staining in almost all liver lobules. (B, C, and D) In contrast, arterial HyFACS—(C) ‐HA; (D) ‐PV + HA—exhibited dense and thick staining along with bile canaliculi, which appeared like “chicken wire.” Similarly, in the SEM observation (Fig. 5), (B) HyFACS‐PV resulted in better staining than in the controls, but (C and D) worse than in arterial HyFACS, demonstrating the superiority of the arterial route for H2 administration to protect biliary epithelia. (E) CEACAM1 staining in sham livers, not cold‐stored but subjected to 2‐hour oxygenated reperfusion, served as a reference for baseline comparison with the 4 experimental groups. (F) The quantification of the CEACAM1‐stained area by using the ImageJ software. All differences among the groups were assessed via 1‐way ANOVA (P < 0.001) followed by Bonferroni’s posttest. *P < 0.05 versus control group.
