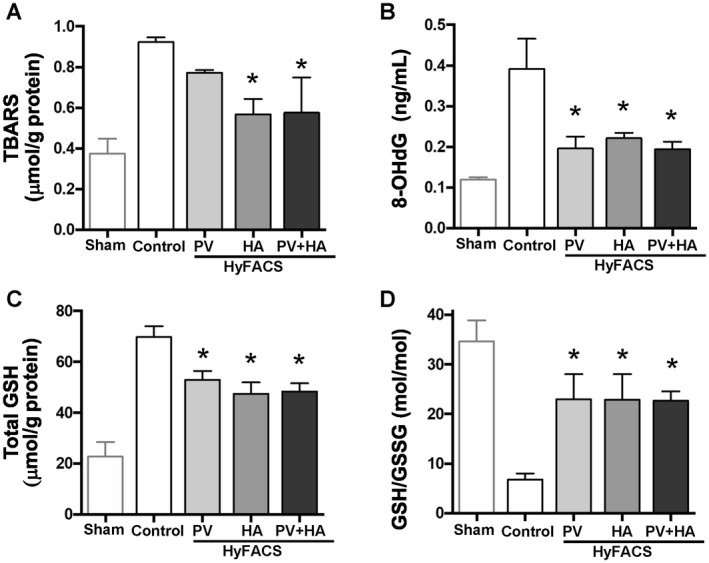
Figure 7.

The oxidative stress and redox status. (A) TBARS level in liver tissue; (B) 8‐OHdG release into the perfusate; and (C) total GSH contents in liver tissue served as parameters for tissue oxidative stresses upon reperfusion (mean ± standard error of the mean, n = 10 each). One‐way ANOVA (P < 0.01 in all 3 parameters) followed by Bonferroni’s posttest. *P < 0.05 versus control group. (D) GSH/GSSG ratio (mol/mol) given as an index for cellular redox status. All differences among the groups were assessed via 1‐way ANOVA (P < 0.01) followed by Bonferroni’s posttest. *P < 0.05 versus control group.
