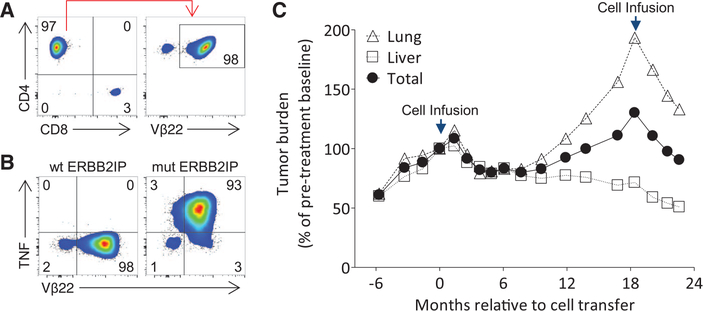
Fig. 4. Evidence of tumor regression after treatment with a highly pure population of Vβ22+ ERBB2IP mutation–reactive CD4+ T cells.
(A) Flow-cytometric analysis of the TIL product used for retreatment. Data are gated on live CD3+ T cells (left) and further gated on CD4+ cells (right).(B) Retreatment TIL were cocultured for 6 hours with autologous B cells pulsed overnight with wt or mut ERBB2IP 25–amino acid–long peptides. Flow cytometry was used to detect intracellular TNF production in the CD4+ population. (A) and (B) are representative of at least two independent experiments. (C) Tumor growth curves (sum of maximum diameters) of patient 3737 before and after first and second adoptive cell transfers. The first infusion product consisted of 42.4 billion T cells containing about 25% (10 billion) Vβ22+ ERBB2IP mutation–reactive TH1 cells. The second infusion product consisted of 126 billion T cells containing over 95% (120 billion) Vβ22+ ERBB2IP mutation–reactive TH1 cells. Data are expressed as a change from baseline and stratified on lung, liver, and total tumors. Some target lesions selected in (C) differ from Fig. 2D because only lesions that were present throughout both treatments were selected for measurement.

