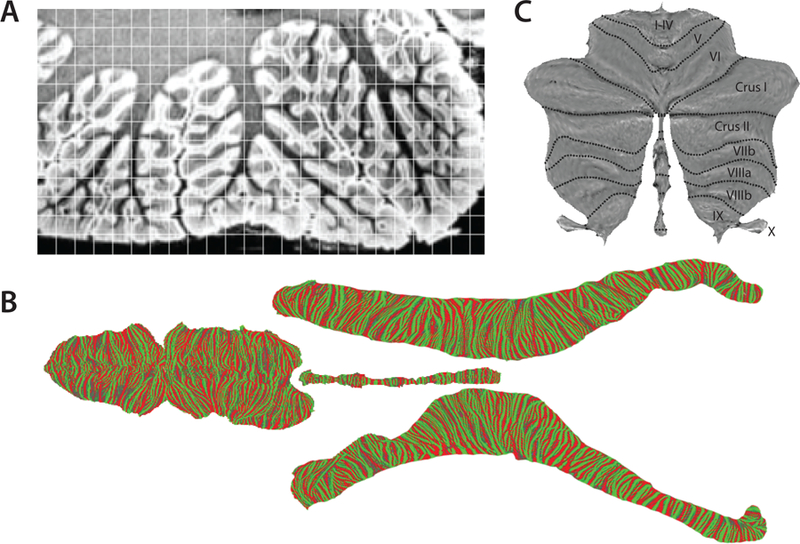
Figure 3.

Surface of cerebellar cortex. (a) A section showing inferior lobules VIIIa, VIIIb and IX of the left hemisphere of a human cerebellum scanned at 150μm resolution. The scan clearly visualizes the granular cell layer in medium gray and the molecular layer in white. The superimposed grid indicates a typical sampling of a functional scan at 1.5mm resolution. (b) Unfolded representation of an entire human cerebellum (Sereno et al., 2014). For flattening, the surface is cut into 4 pieces. Color indicates local curvature, with green indicating the crest of a folia. (c) Simplified surface at the level of cerebellar lobules for the display of volume-averaged function data (Diedrichsen and Zotow, 2015).
