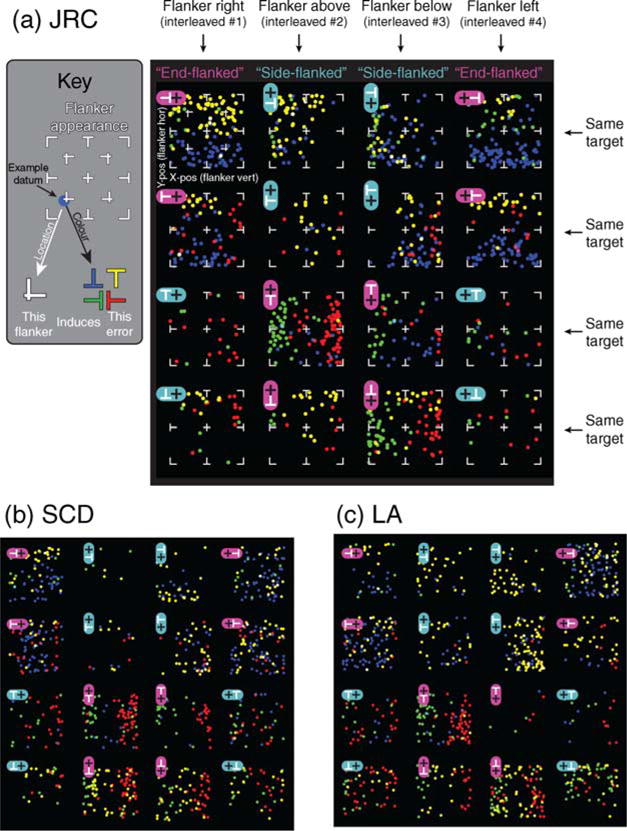
Figure 4.

(a) Each of the 4 × 4 panels plots the errors arising for a given flanker–target configuration (a schematic stimulus is inset in each panel). Dot color codes the target orientation reported by the subject, and the position of the dot within the plot codes the flanker configuration on that trial (see “Key”). Note lower error rates in cyan- compared to magenta-labeled panels, corresponding to side-flanked and end-flanked conditions, respectively. This refers to the flanker location relative to the target after the whole stimulus was rotated so the target was an upright T. Note also that errors arising from end flankers (magenta-labeled) correlate with flanker appearance, whereas errors from side flankers (cyan-labeled) are less structured.
