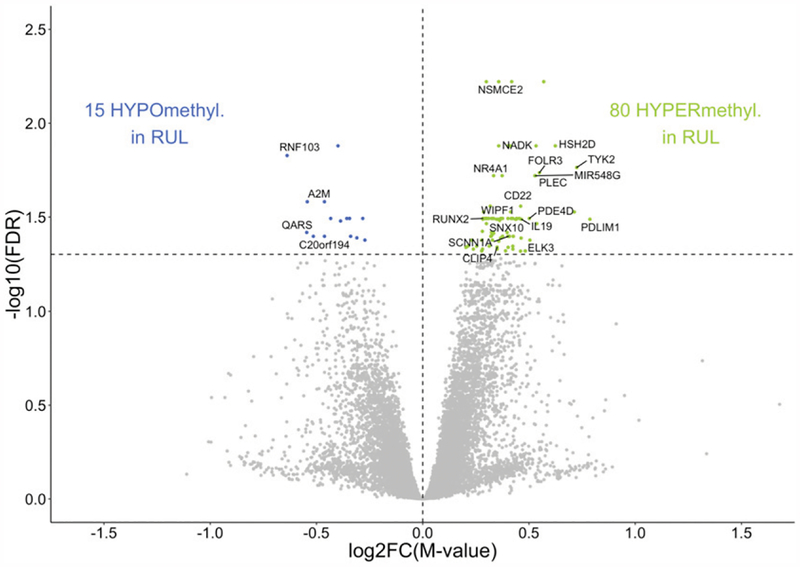
FIGURE 3. Epigenome-wide differential methylation in RUL macrophages.
Comparative analysis of DNA methylation in upper versus lower lobe macrophages in healthy subjects identified 95 differentially methylated CpGs (FDR p < 0.05). CpGs hypermethylated in RUL (green), and hypomethylated CpGs (blue) are plotted as log2-fold increase or decrease in methylation M value (x-axis) versus log10 FDR-adjusted p value (y-axis). Statistically significant CpGs associated with specific genes are labeled, and unlabeled points represent CpGs associated with no known gene at that location.

