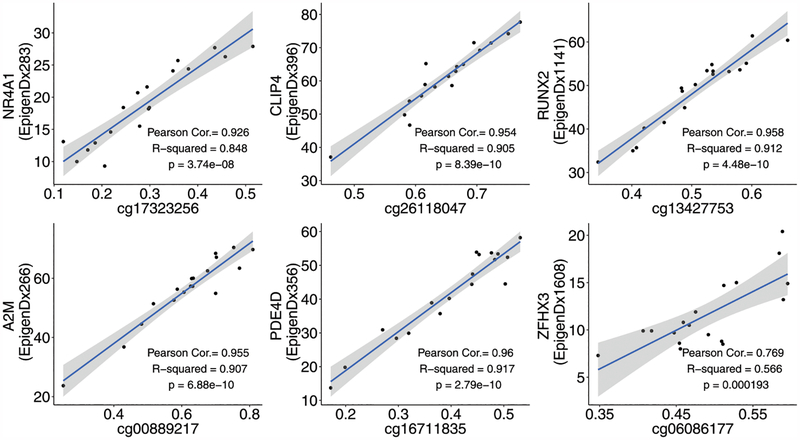
FIGURE 4. Correlation of DNA methylation analysis between Illumina EPIC methylation array and tNGBS platforms.
Correlation coefficients and linear regression p values were determined for CpGs associated with the genes NR4A1, CLIP4, RUNX2, A2M, PDE4D, and ZFHX3 as methodology validation, directly comparing the Illumina EPIC DNA methylation array and tNGBS assays.

