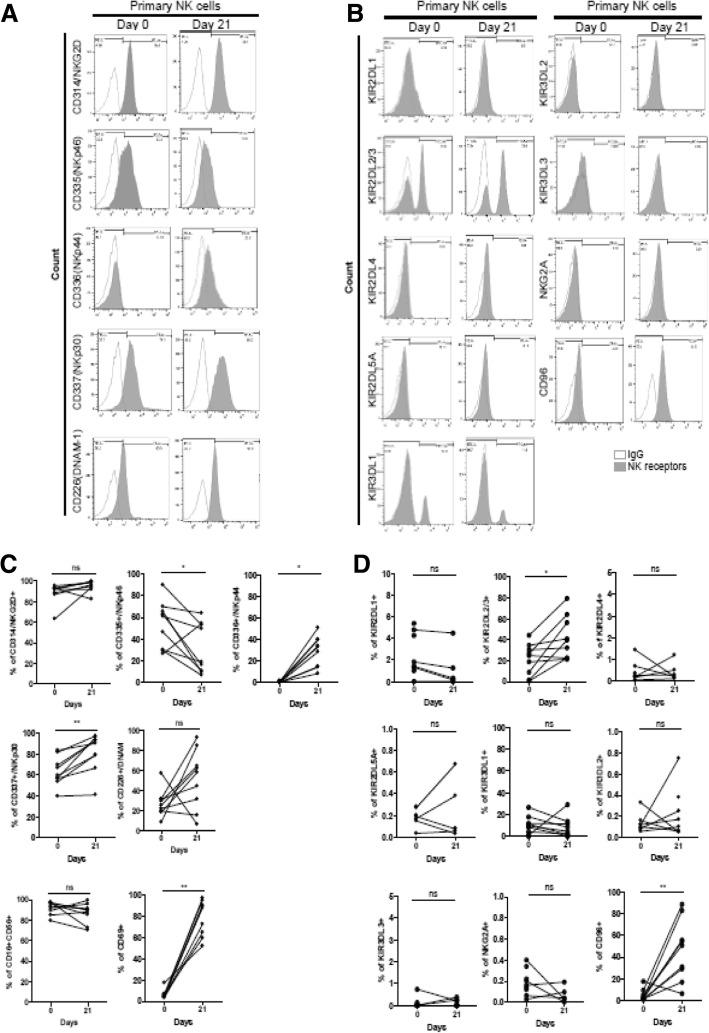
Fig. 2.
Flow cytometry analysis of NK cell receptors on human primary NK cells. (A) Cell surface expression of the indicated molecules on primary human NK cells on day 0 and day 21. Cells were stimulated with cytokine combinations (IL-15, IL-18, and IL-27) for 21 days. Primary NK cells from healthy donors were stained for expression of NK cell activating receptors (a) and inhibitory receptors (b), as indicated. Histograms show representative examples of NK cell receptor expression (shadow area) and show the percentage of NK cells positive for a given receptor relative to the isotype control (gray lines). NK cells were gated as viable, single, CD3-CD56+ cells. (c-d) Statistical analysis for the difference in NK cell receptor expression between day 0 and day 21. Significant differences are indicated in the graph as follows: *P < 0.05 and ** P < 0.01, compared with day 0. n.s: not significant

