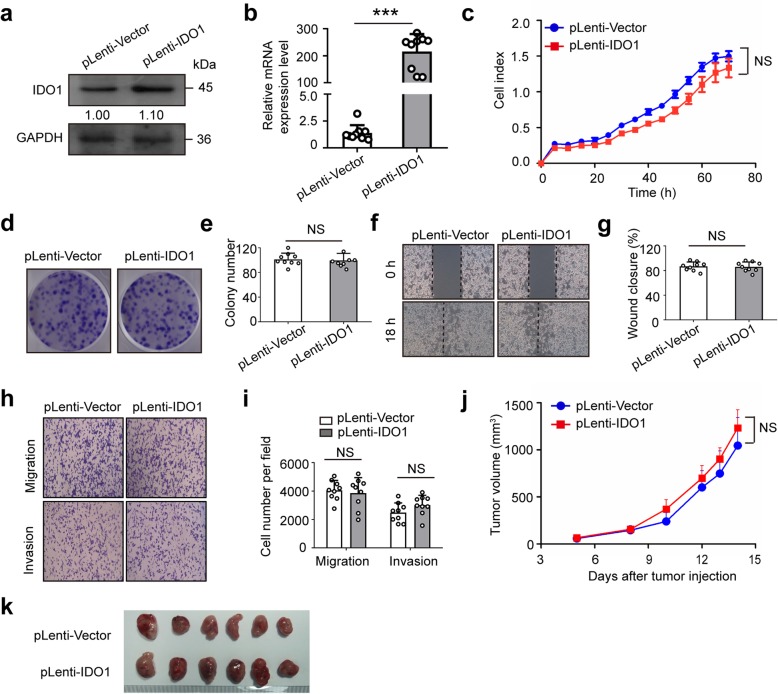
Fig. 1.
IDO1 overexpression has no effect on the migration, invasion and proliferation of CT26 cells. a Representative western blots and b qRT-PCR results of IDO1 in CT26 cells from the stable IDO1 overexpression (pLenti-IDO1) group and the vector control (pLenti-Vector) group. GAPDH was served as the internal control. c Representative pictures of real-time proliferation assay in CT26 cells from the pLenti-IDO1 group and the pLenti-Vector group. d Representative pictures and e quantitative data of colony formation assay in CT26 cells from the pLenti-IDO1 group and the pLenti-Vector group. f Representative pictures and g quantitative data of wound healing assay in CT26 cells from the pLenti-IDO1 group and the pLenti-Vector group. h Representative pictures and i quantitative data of transwell assay in CT26 cells from the pLenti-IDO1 group and the pLenti-Vector group. a, c, d, f, h Images are representative of three biological replicates. j Average growth curves of subcutaneous xenograft tumors in BALB/c nude mice after inoculation of CT26 cells with pLenti-IDO1 or with pLenti-Vector. k Representative pictures of tumors in BALB/c nude mice from the pLenti-IDO1 group and the pLenti-Vector group. b, c, e, g, i, j Mean ± SEM. b, e, g, i n = 9 measurements from three biological replicates performed in triplicate; c n = 3; j, k n = 6. b, c, e, g, i Two-tailed Student’s t-test and j one-way ANOVA were performed for statistical analysis; ***P < 0.001, NS: not significant

