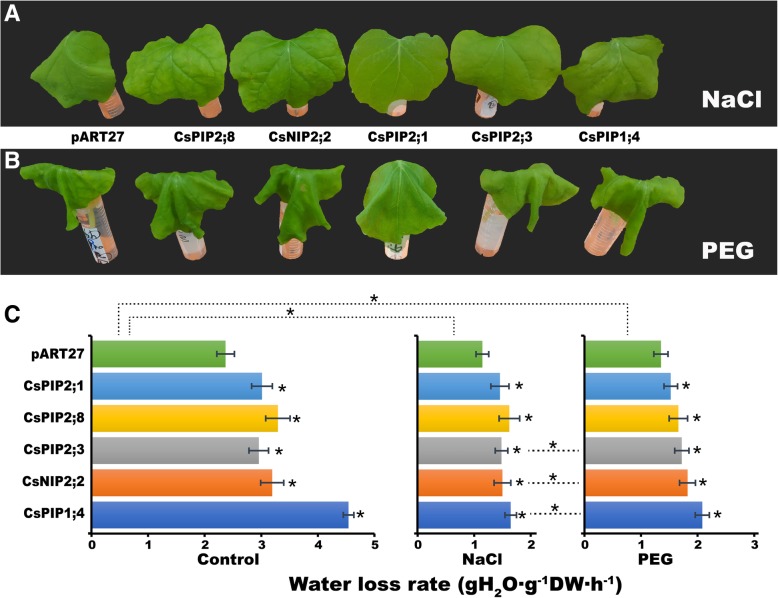
Fig. 11.
Overexpression of AQPs transiently affected water loss rate in tobacco leaves. Phenotype of detached leaves after 6 h of (a) NaCl and (b) PEG treatments; (c) The water loss rate of detached leaves after 6 h of NaCl, and PEG treatments. In (c), asterisks in the left (CK), middle (NaCl), and right (PEG) panels indicate statistically significant differences of each gene compared to pART27. Asterisks above left (CK), middle (NaCl), and right (PEG) panels indicate statistically significant differences of each gene in NaCl or PEG treatment compared to that in CK. Asterisks between middle (NaCl), and right (PEG) panels indicate statistically significant differences of each gene between NaCl and PEG treatments. Data are means ± SE of n = 3 biological replicates, at least 10 leaves per replicate. * indicates significance, p < 0.05 as determined using the Student’s t-test

