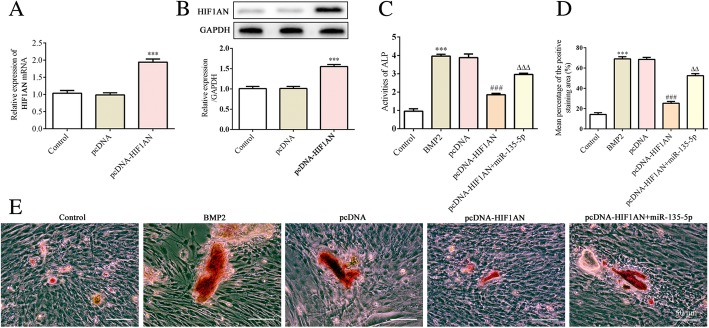
Fig. 5.
The levels of ALP and calcification after HIF1AN overexpression or knockdown during osteoblast differentiation of MC3T3-E1 cells after incubation in DM supplemented with BMP2 for 14 days. a and b – The expression of HIF1AN following MC3T3-E1 cells being transfected with HIF1AN pcDNA3.1 or pcDNA3.1 was measured via quantitative RT-PCR (a) and western blot (b). ***p < 0.001 vs. pcDNA. c – The level of ALP was measured using an ALP assay kit. d – The area stained with alizarin red staining was quantified. e – The level of calcification was measured using alizarin red staining. ***p < 0.001 vs. control; ###p < 0.001 vs. pcDNA; △△p < 0.01, △△△p < 0.001 vs. pcDNA-HIF1AN + miR-135-5p

