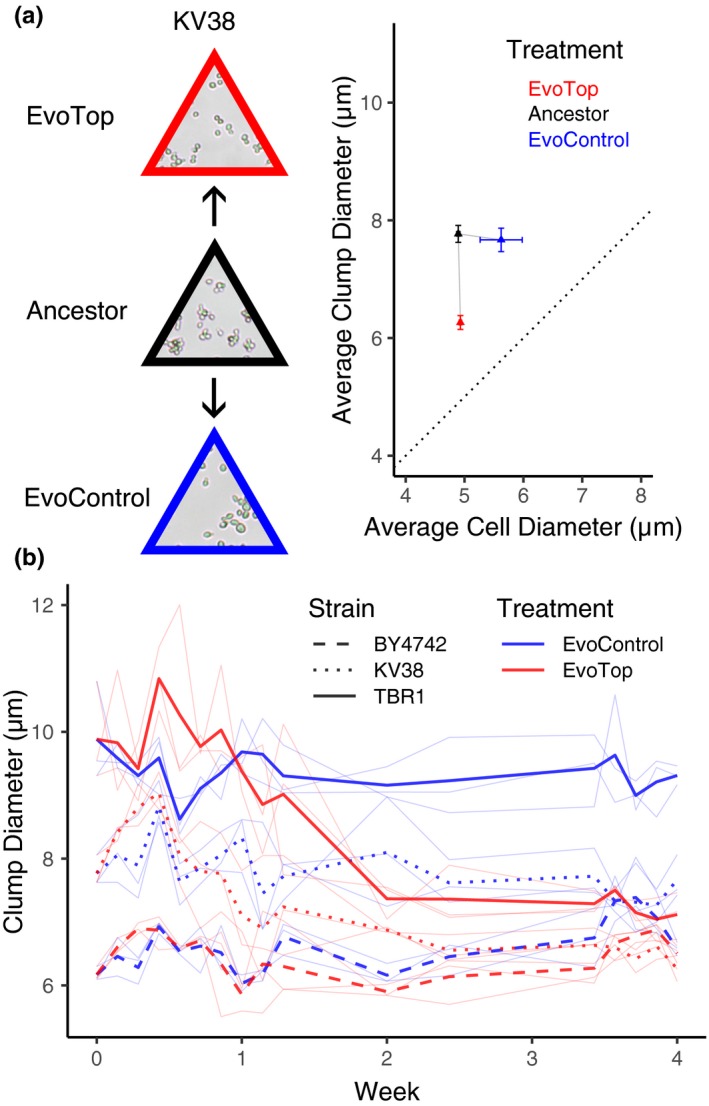
Figure 3.

EvoTops derived from clumping strains are smaller than their ancestors. (a) KV38's mean EvoTop (red triangle) clump diameter was significantly smaller than that of the ancestral (black triangle) and EvoControl lines (blue triangle; one‐way ANOVA F(2, 6) = 28.61, p = 0.001; Games–Howell post hoc test, p < 0.05, error bars indicate SEM), which did not vary significantly from each other (p > 0.05). The diameters of KV38's EvoControl cells, ancestral cells, and EvoTop cells did not vary significantly from each other (one‐way ANOVA F(2, 6) = 3.93, p = 0.081). The dotted line indicates a 1:1 cell diameter to clump diameter ratio, where nonbudding unicellular strains would theoretically lie. (b) TBR1 (solid bold lines) and KV38 (dotted lines) EvoTop clumps (red lines, week 4) were significantly smaller than their corresponding ancestral (week 0) and EvoControl clumps (blue lines, week 4), while the average BY4742 (dashed lines) EvoControl and EvoTop clump diameters (week 4) tended to be larger than their ancestor's (week 0). Replicates are shown in thin light blue and red lines
