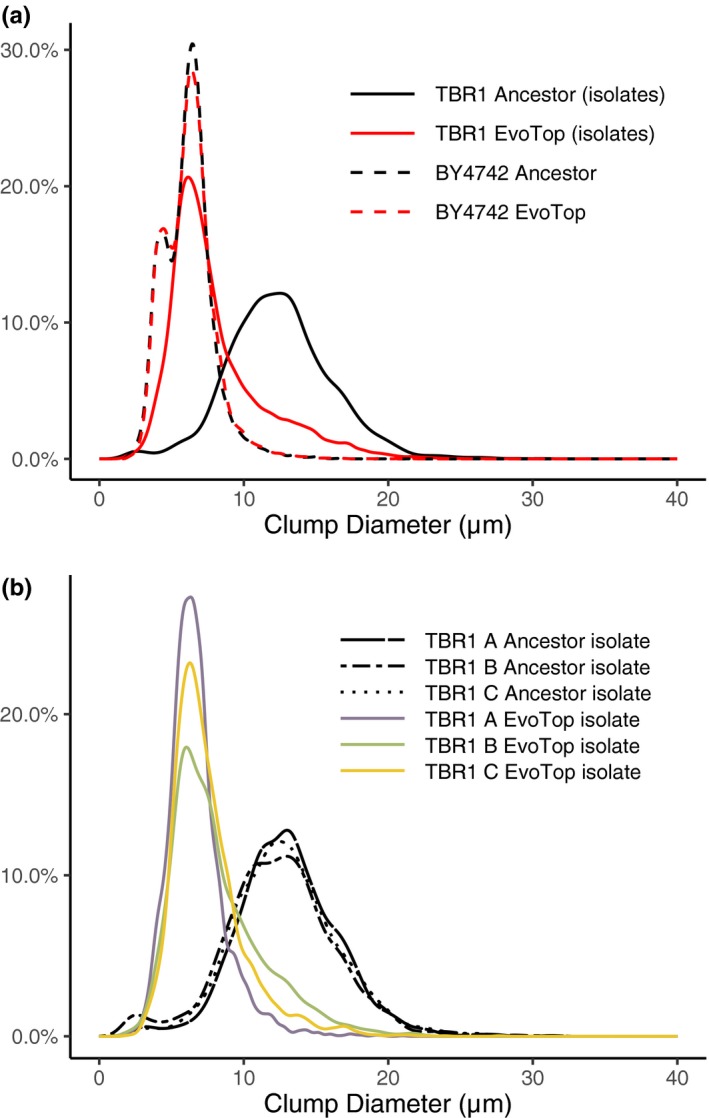
Figure 4.

TBR1 EvoTop diameter distributions shifted left, while BY4742 remained similar. (a) In SD‐tryp + 2% glucose medium, the clump diameter distribution of TBR1 EvoTop stress tested isolates (solid red line) approached that of the unicellular laboratory strain BY4742 (dashed lines). Clump distributions are from the combined data points of all lines (A, B, and C) within a variant (TBR1 ancestor, TBR1 EvoTop, BY4742 ancestor, and BY4742 EvoTop). (b) TBR1 EvoTop stress tested isolates have similar clump size distributions. In SD‐tryp + 2% glucose medium, the TBR1 B EvoTop isolate (green line) and the TBR1 C EvoTop isolate (orange line) have clump diameter distributions that are similar to that of the TBR1 A EvoTop isolate (purple line)
