
Figure 6.
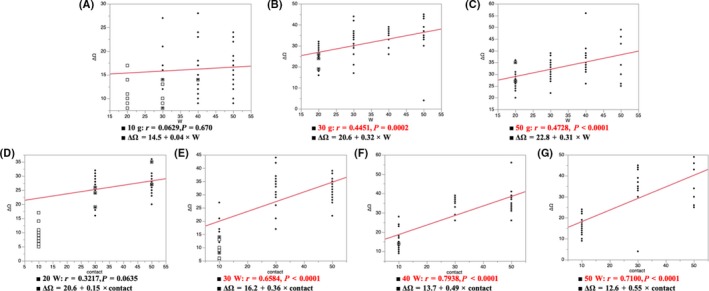
A‐C show the correlation between the impedance drop and power under the same CF. D‐G show the correlation between the impedance drop and CF under the same power. The impedance drop level to the steam pops differed according to the ablation settings