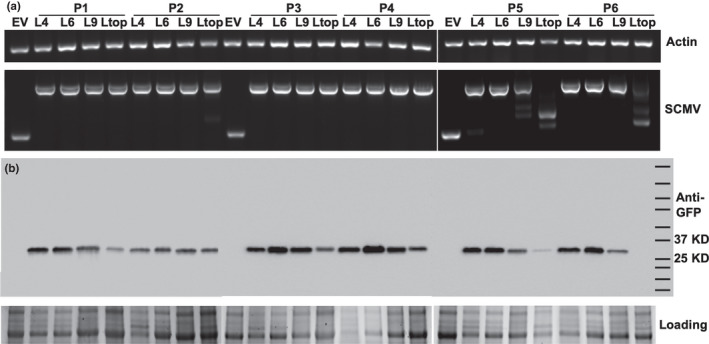
Figure 4.

SCMV‐mediated GFP expression in sweet corn (Golden × Bantam). (a) RT‐PCR analyses for the GFP insert stability in SCMV‐CS1‐GFP‐infected plants. The upper gel image is the RT‐PCR control showing amplification of a single maize actin1 mRNA fragment in all samples. The lower gel image is RT‐PCR amplification across the SCMV cloning site. EV indicates the SCMV‐CS1 empty vector that carries no insert. L4, L6, L9, and Ltop indicate the leaf number that was sampled. (b) Western blot analysis showing GFP expression in SCMV‐CS1‐GFP‐infected leaf tissues that are presented in panel A. The upper panel shows the 27 kDa band corresponding to GFP protein detected using anti‐GFP antibody and chemiluminescence. The lower panel shows the protein loading control
