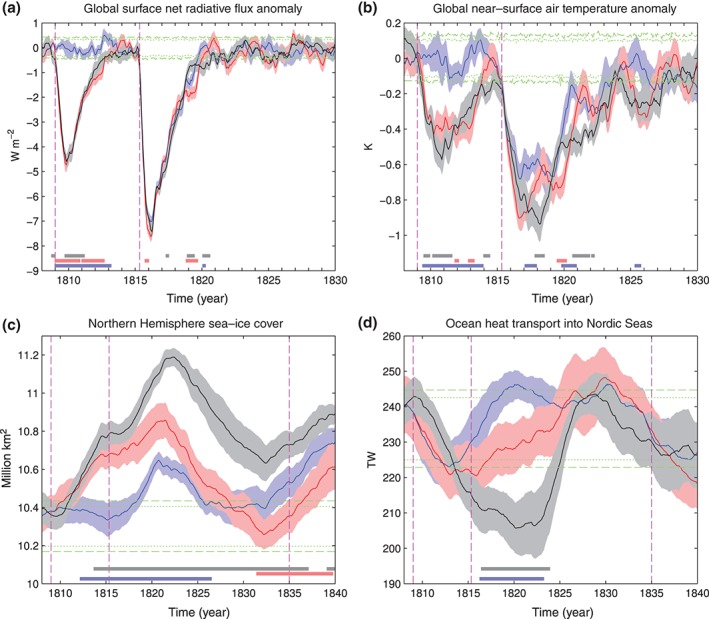
Figure 7.

Simulated global climate evolution of different variables in a 10 member ensemble of simulations including all natural and anthropogenic forcing (black), a 10 member ensemble with only volcanic forcing including the Tambora and the preceding 1808/1809 eruption (red), and a 10 member ensemble with only volcanic forcing without the 1808/1809 eruption (blue). The all forcing simulations are started in 1751 from initial conditions taken from the COSMOS‐Mil experiments,146 the volcanic forcing only from a control run for 800 AD conditions. Lines indicate means. Shading indicates one standard error of the mean. Green dashed lines are the 5th–95th percentile intervals for signal occurrence in the control run (see second section). The inner dotted lines are the 10th–90th percentile intervals. Magenta vertical lines indicate the occurrence of the 1808/1809 and Tambora and Cosiguina eruptions. Bottom rectangles indicate periods when there is a significant difference between an ensemble (color same as for time series) and the other two. Positive surface net radiative flux anomalies correspond to increased downward flux. The unit of the ocean heat transport is 1 TW = 1012 W. (Reprinted with permission from Ref 81. Copyright 2013 John Wiley and Sons)
